Apartment Vacancies in U.S. Fall to Lowest in Almost Three Years
…
Effective rents, or what tenants actually pay, increased in 75 of the 82 markets Reis tracks, to an average $991 a month from $967 a year earlier and $986 in the fourth quarter. Landlords’ asking rents also climbed, to $1,047 from $1,027 a year earlier and $1,043 in the previous quarter, according to the report.
…
San Jose, California, had the most growth in effective rents during the past year, with 5.2 percent, followed by suburban Virginia and New York City, according to Reis. Effective rents declined 1.5 percent in Las Vegas during the year and grew the least in Orlando, Florida; and Colorado Springs, Colorado.
Rents have been slowly recovering the last year, after the economic shocks of the credit crisis. People, moved back into parents house and more people started sharing apartments and houses in the last few years as people where thrown out of jobs due to the after effects of the financial actions by large financial institutions. Slowly the economy has been recovering and jobs have been slowly growing and as a result the rental market has been strengthening .
Also the decline in construction the last few years has decreased the normal addition to supply. At the same time the population has continued growing. Some areas of the country seem to still have a large overcapacity in housing but areas that are adding jobs (such as Northern Virginia and New York City) are seeing increasing rents.
I have 2 properties for rent in Arlington, Virginia.
Related: Landlords See Increase in Apartment Rentals (July 2010) – USA Housing Inventory Puts Pressure on Prices (Sep 2010) – Apartment Rents Rise, Slightly, for First Time in 5 Quarters (Apr 2010) – It’s Now a Renter’s Market (Apr 2009) – Housing Rents Falling in the USA (Feb 2009)
Law enforcement officers, pre-Kindergarten through 12th grade teachers and firefighters/emergency medical technicians can contribute to community revitalization while becoming homeowners through HUD’s Good Neighbor Next Door Sales Program. HUD (United States Department of Housing and Urban Development) offers a substantial incentive in the form of a discount of 50% from the list price of the home. In return you must commit to live in the property for 36 months as your sole residence.
Eligible Single Family homes located in revitalization areas (there are hundreds of revitalization areas across the country. HUD is always working with localities to designate new areas) are listed exclusively for sales through the Good Neighbor Next Door Sales program. Properties are available for purchase through the program for five days.
Check the listings for your state. Follow the instructions to submit your interest in purchasing a specific home. If more than one person submits on a single home a selection will be made by random lottery. You must meet the requirements for a law enforcement officer, teacher, firefighter or emergency medical technician and comply with HUD’s regulations for the program.
HUD requires that you sign a second mortgage and note for the discount amount. No interest or payments are required on this “silent second” provided that you fulfill the three-year occupancy requirement.
Related: Fixed Mortgage Rates Reach New Low – Your Home as an Investment – articles on home ownership
I am looking at mortgage refinance options now (with rates being so low). I am looking at 20 year fixed rate loans with cash out (with over 20% down). The 20 year term will reduce my loan term a bit, and the final monthly cost should actually be not much higher than my current payment (with taking some cash out), I think. Do any readers have opinions on these lenders (or others with competitive offers – low rates and low expenses)?
Total Mortgage – 20 year fixed rate 3.875%, total fees and points not provided :-(, apr 4.15%
American United Mortgage – 20 year fixed rate 4% [same as 30 year rate :-(], fees $2,995 (0 points), apr 4.26%
Aim Loan – 20 year fixed rate 3.875%, fees (about $4,100 I think), apr 4.02%
These are some of the best deals I have been able to find. However, companies can play games with fees and hide excessive costs in requirements they don’t consider fees (appraisal costs…). Rates can bounce around for a specific lender, so I think it make sense to watch several (not just pick out he lowest one on whatever date you first look).
Suggestions on how to tell whether specific lenders good faith estimates are accurate and comparable would be especially appreciated.
Edits:
RoundPoint – looks good, low rates, low fees, good reviews on Zillow.
Amerisave – 20 year fixed rate 3.75%, total fees and points $3,418, apr 3.87% (removed as an option – they don’t respond to customer have tons of negative reviews online about problems, poor service, etc.
Related: Fixed Mortgage Rates Reach New Low – Low Mortgage Rates Not Available to Everyone – 30 Year Fixed Mortgage Rates and the Fed Funds Rate – Mortgage terms
U.S. Home Prices Face Three-Year Drop as Supply Gains
…
Sales of new and existing homes fell to the lowest levels on record in July as a federal tax credit for buyers expired and U.S. unemployment remained near a 26-year high.
…
There were 4 million homes listed with brokers for sale as of July. It would take a record 12.5 months for those properties to be sold at that month’s sales pace, according to the Chicago- based Realtors group.
…
In addition to the as many as 8 million properties vacant or in foreclosure, owners of another 3.8 million homes — 5 percent of U.S. households — said they are “very likely” to put their properties on the market within six months if there is improvement, according to a survey by Seattle-based Zillow.
…
Owners of about 11 million homes, or 23 percent of households with a mortgage, owed more than their property was worth as of June 30, according to CoreLogic. Another 2.4 million borrowers had less than 5 percent equity in their houses and probably would lose money on a sale after paying broker fees and closing costs, CoreLogic said Aug 25.
The shadow inventory, poor job market and low net home equity positions continue to put a huge amount of pressure on the housing market. Very low interest rates help support the market but not much else does. In some locations the rental market is starting to help. But the tightening of credit standards is reducing the pool of potential buyers. While it is a good thing (because credit standards were far too loose) it still will extend the duration of a bear housing market.
I would be looking to buy now, if I didn’t own a house already (and was planning on staying long term).
Related: Real Estate and Consumer Loan Delinquency Rates 2000-2010 – 10 million More Renters In the Next 5 Years – The Value of Home Ownership – Nearly 10% of Mortgages Delinquent or in Foreclosure (Dec 2008)
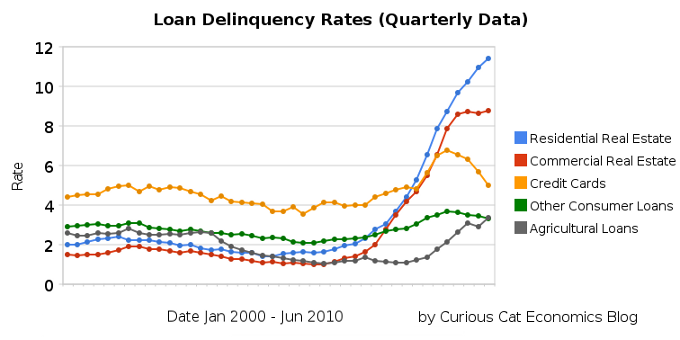
The chart shows the total percent of delinquent loans by commercial banks in the USA.

The first half of 2010 saw residential real estate delinquencies continue to increase and other consumer loan delinquencies decreasing (both trends continue those of the last half of 2009). Residential real estate delinquencies increased 118 basis points to 11.4%. Commercial real estate delinquencies increased just 7 basis points to 8.79%. Agricultural loan delinquencies also increased (25 basis points) though to just 3.35%. Consumer loan delinquencies decreased, with credit card delinquencies down 131 basis points to 5.01% and other consumer loan delinquencies down 15 basis points to 3.34%.
Related: Real Estate and Consumer Loan Delinquency Rates 1998-2009 – Bond Rates Remain Low, Little Change in Late 2009 – Government Debt as Percentage of GDP 1990-2008 – USA, Japan, Germany… –posts with charts showing economic data
Read more
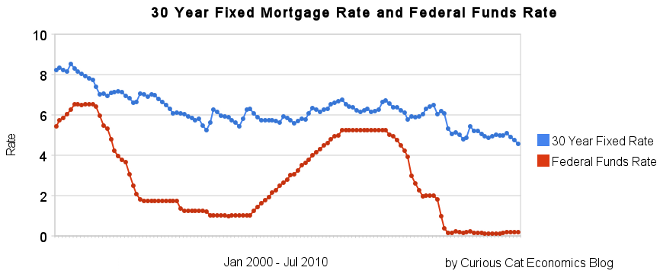
30 year fixed mortgage rates have declined sharply recently to close to 4.5%.

If you are considering refinancing a mortgage now may well be a very good time. If you are not, you maybe should consider it. If so look to shorten the length. If you originally took out a 30 year mortgage and now have, for example, 24 years let, don’t add 6 years to your repayment term by getting a new 30 year mortgage. Instead, look to shorten your pay back period with a 20 year mortgage. The 20 year mortgage will have an even lower rate than the 30 year mortgage.
If you plan on staying in the house, a fixed rate mortgage is definitely the better option, in my opinion. If you are going to move (and sell your hose) in a few years, an adjustable rate mortgage may make sense, but I would learn toward a fixed rate mortgage unless you are absolutely sure (because situations can change and you may decide you want to stay).
The poor economy, unemployment rate still at 9.5%, has the Fed continuing massive intervention into the economy. The Fed is keeping the fed funds rate at close to 0%.
If you are looking at a new real estate purchase, financing a 30 year mortgage sure is attractive at rates under to 4.5%.
Related: historical comparison of 30 year fixed mortgage rates and the federal funds rate – 30 Year Fixed Mortgage Rates Remain Low (Dec 2009) – Lowest 30 Year Fixed Mortgage Rates in 37 Years – What are mortgage definitions
For more data, see graphs of the federal funds rate versus mortgage rates for 1980-1999. Source data: federal funds rates – 30 year mortgage rates
Renter Nation by Gene Epstein
…
Demographics also will deal home sellers and builders a clear blow. Not surprisingly, the home-ownership rate tends to rise with age. For example, while the overall U.S. rate is 67.2%, the rate for households headed by someone under 35 is just 38.9%.
Thus, whenever the age distribution of households tilts in favor of younger adults, the overall home-ownership rate declines.
…
Largely because the echo boomers are more numerous than the baby busters, there are now more U.S. residents aged 15 to 29 than 30 to 44. So five years from now, the nation will have more 20-to-34-year-olds than 35-to-49-year-olds.
…
Dallas-based Axiometrics tracks monthly price and occupancy data on apartments in 305 markets around the country. Its research chief, Jay Denton, reports that, on new leases written through this year’s first six months, effective rents—those after all concessions are taken into account—rose a robust 3.2%, after declining through 2009 and much of 2008. And occupancy growth, adds Denton, is close to the best he’s seen in the past 13 years.
Related: articles on real estate investing – Real Estate and Consumer Loan Delinquency Rates 1998-2009 – Apartment-vacancy Rate is 7.8%, a 23-year High (Nov 2009)
Apartment Rentals Surge in U.S. on Foreclosures, Jobs
…
The Bloomberg REIT Apartment Index has gained 28 percent this year, double the 14 percent advance in the broader Bloomberg REIT Index.
…
Finances for homeowners didn’t improve fast enough to prevent more than 1.65 million foreclosure filings in the first half, an increase of 8 percent from the same period in 2009, RealtyTrac Inc., a data company in Irvine, California, said July 15. A record 269,962 U.S. homes were seized from delinquent owners in the second quarter as lenders set a pace to claim more than 1 million properties by the end of 2010.
The U.S. homeownership rate fell to 66.9 percent in the second quarter, the lowest since 1999, the U.S. Census Bureau said today. The rate peaked at 69.2 percent in the fourth quarter of 2004.
…
Effective rents, or what tenants pay after concessions or breaks from landlords, increased 1.4 percent in the biggest markets in the first half, according to MPF Research. Rents may rise 4 percent to 6 percent in both 2011 and 2012, compared with a gain of about 2 percent this year, Willett said.
Rentals are picking up partially due to the economy picking up allowing some who moved into their parents house to move back out. Also the continued numbers of people losing their houses increases the ranks of potential renters. The market is still absorbing many people reducing their housing footprint (people joining up with others to save on expenses). This is one of several important areas to watch (job growth is still probably the most important). As large numbers of apartment are rented and houses are rented or bought it is a strong indicator people are gaining some financial stability.
Related: Apartment Rents Rise, Slightly, for First Time in 5 Quarters (April 2010) – Apartment-vacancy Rate is 7.8%, a 23-year High (Nov 2009) – Sales of New Homes Plunged in USA in May to Record Low
Apartment Rents Rise as Sector Stabilizes
…
enters are also staying put longer: the average renter now stays for 19 months, up from an average of 14 months, said Mr. Friedman, and despite low mortgage rates and greater home affordability, fewer renters are leaving to buy homes. “This is the first time in many, many years that it feels like even people who could afford to buy are making the investment decision not to,” Mr. Friedman said.
…
Portland, Ore., posted the largest rent decline, at 0.7%, followed by Las Vegas, San Diego, and Southern California’s Inland Empire. Those three markets have all seen an uptick in home-buying activity, particularly among the low end from first-time buyers and investors.
Colorado Springs had the largest rent increases, 2.5%, followed by Washington DC, 2% and San Antonio 1.5%. There is a very nice new online tool, Padmapper, for renters or landlords. It is a mashup on Google Maps of rental listings by location from Craigslist and other sources. Very good search options. Easy to use. Find more real estate links on the Curious Cat Cool Connections Directory.
Related: It’s Now a Renter’s Market (April 2009) – Housing Rents Falling in the USA (February 2009) – Apartment-vacancy Rate is 7.8%, a 23-year High
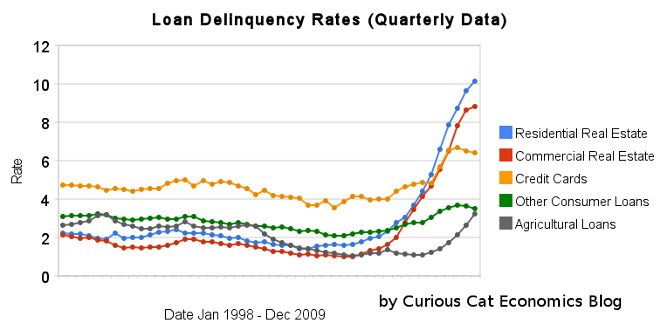
The chart shows the total percent of delinquent loans by commercial banks in the USA.

That last half of 2009 saw real estate delinquencies continue to increase. Residential real estate delinquencies increased 143 basis points to 10.14% and commercial real estate delinquencies in 98 basis points to 8.81%. Agricultural loan delinquencies also increased (112 basis points) though to just 3.24%. Consumer loan delinquencies decreased with credit card delinquencies down 18 basis points to 6.4% and other consumer loan delinquencies down 19 basis points to 3.49%.
Related: Loan Delinquency Rates Increased Dramatically in the 2nd Quarter – Bond Rates Remain Low, Little Change in Late 2009 – Government Debt as Percentage of GDP 1990-2008 – USA, Japan, Germany… – posts with charts showing economic data
Read more