The lowest 30 Year fixed mortgage rates in 37 years is great news for those looking to buy a house or to re-finance. However, that truth (the lowest rate) masks another truth, that it is available to a somewhat limited pool of borrowers. The rates for jumbo 30 year fixed mortgages and for regular 30 year fixed mortgages, for those with lower credit ratings, are not at the lowest rates they have ever reached. And getting mortgage rates that don’t require a 10-20% down payment and fully documented financial position are not as low as they have ever been. 15 year fixed rates are also low, but are not at all time lows. FHA loans still allow very low down payments, but others have moved away from this practice (which is a wise move).
Current rates, national average, from Bankrate: 30 year fixed 5.26%, 30 year fixed jumbo 6.96% (a full 170 basis points higher rate), 15 year fixed 5.07%. Jumbo rates have been less than 40 basis points higher than conventional rates most of time (based on my memory – I am looking for a source to confirm). The site does not present the credit score but my guess is these rates are based on a credit score of 700, or higher. Last week the jumbo rates increased by 11 basis points and regular 30 year rates fell by 3 basis points.
Related: Jumbo v. Regular Fixed Mortgage Rates: by Credit Score – historical mortgage rate chart – Nearly 10% of Mortgages Delinquent or in Foreclosure – misinterpreting data
Changes in the Market For Jumbo Mortgages
…
On Nov 12, 2008 I shopped for an $800,000 30-year fixed-rate mortgage on Mortgage Marvel, an on-line site that I reviewed earlier in 2008 (see A Look at Mortgage Marvel). The mortgage companies on the site quoted rates of 8.125% to 8.375%. The credit unions and banks, in contrast, quoted rates ranging from 5.875% to 7.875%. I have never before seen rate differences on the same transaction this large. They no doubt reflect wide differences in lender access to funding, which is symptomatic of a market in turmoil.
We now have the lowest 30 year fixed mortgage rates since data has been collected (37 years) in the USA. Is this due to the Fed cutting the discount rate? I do not think so. As I have said previously 30 year fixed rates are not correlated with federal reserve rates. But this time the government is actively seeking to reduce mortgage rates.
Mortgage Rate Hits 37-Year Low
…
The 15-year fixed-rate mortgage averaged 4.92%, down from last week when it averaged 5.20%. A year ago the 15-year loan averaged 5.79%. The 15-year mortgage hasn’t been lower since April 1, 2004, when it averaged 4.84%.
Homeowners refinance, put savings under mattress
These rates sure are fantastic if you are in the market. I was not in the market, but I am considering re-financing now. You need to be careful and not just withdraw money because you can. If you can refinance and reduce your payments it may well be a wise move though. One problem can be extending the date you will finally be free of mortgage debt. If you re-finance a current 30 year loan, that you got 5 years ago, you will now be paying 5 more years. One option is to see if you can get a 25 or 20 year loan. Or if you can make a 15 year loan work, do that (15 and 30 year fixed rate mortgages are common).
Read more
Treasury bills have been providing remarkably low yields recently. And the Fed today cut their target federal funds rate to 0-.25% (what is the fed funds rate?). With such low rates already in the market the impact of a lowered fed funds rate is really negligible. The importance is not in the rate but in the continuing message from the Fed that they will take extraordinary measures to soften the recession.
There are significant risks to this aggressive strategy (and there would be risks for acting cautiously too). But I cannot understand investing in the dollar under these conditions or in investing in long term bonds (though lower grade bonds might make some sense as a risky investment for a small portion of a portfolio as the prices have declined so much).
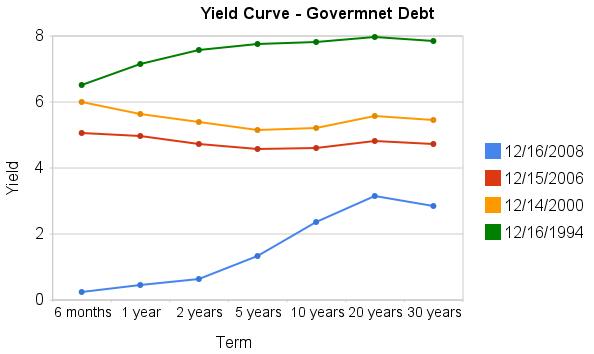
The current yields, truly are amazing as this graph shows. The chart shows the yield curve in Dec 2008, 2006, 2000 and 1994 based on data from the US Treasury
Related: Corporate and Government Bond Rates Graph – Discounted Corporate Bonds Failing to Find Buying Support – Municipal Bonds After Tax Return – Total Return
S&P 500 Payout Tops Bond Yield, a First Since 1958 (site broke the link, so I removed it):
…
Treasuries routinely had higher yields than stocks before 1958, according to Bernstein. When this relationship came to an end, yields were near their current levels. The S&P 500 dividend yield fell 0.58 percentage point, to 3.24 percent, in the third quarter of 1958. The 10-year yield rose about the same amount, 0.6 point, to 3.80 percent.
Two explanations later emerged for the reversal, he wrote. One held that the economy’s recovery from the 1957-58 recession showed “investors could finally put to rest the widely held expectation of an imminent return to the Great Depression.” The second was the increasing popularity of investing in growth stocks, or shares of companies whose sales and earnings rose at a relatively fast pace. Because of their expansion, the companies often paid below-average dividends.
Reversal of Fortunes Between Stocks and Bonds
Arnott takes it a step further. “In a world of deleveraging, both for the financial services arena and for the economy at large, growth is less certain,” he says. “And with the economy eroding sharply, so is inflation. If stocks don’t deliver nominal growth in dividends and earnings, then their yield ‘must’ exceed the Treasury yield, in order to give us any sort of risk premium.”
Related: Corporate and Government Bond Rates Graph – Highest Possible Returns – posts on interest rates – investing strategy
More dramatic evidence that changing in the federal funds rate do not lead to similar changes in 30 year fixed mortgage rates. It is true the last few months are very unusual times for the credit market. However, the current lack of correlation is not the exception, the graph clearly shows there is very little correlation between changes in the two interest rates.
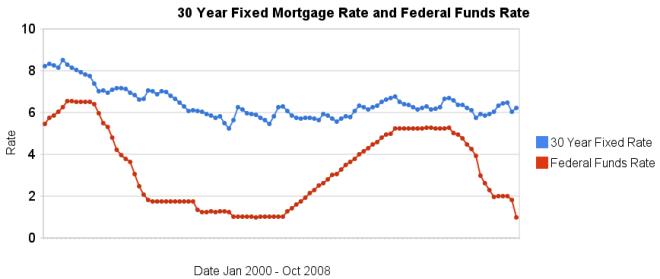
Related: historical comparison of 30 year fixed mortgage rates and the federal funds rate – Affect of Fed Funds Rates Changes on Mortgage Rates – posts on financial literacy – Jumbo v. Regular Fixed Mortgage Rates: by Credit Score
For more data, see graphs of the federal funds rate versus mortgage rates for 1980-1999. Source data: federal funds rates – 30 year mortgage rates
‘Armageddon’ Prices Fail to Lure Buyers Amid Selling
…
The selling is being compounded by hedge funds and mutual funds dumping holdings to meet redemptions, which may push prices even lower, according to analysts at UBS AG.
…
Corporate debt has been pressured by “incessant selling by hedge funds and leveraged institutions as they unwind,” Bill Gross, manager of the world’s biggest bond fund at Newport Beach, California-based Pacific Investment Management Co.
…
Corporate bond prices plunged to 79.9 cents on the dollar on average from 94 cents at the end of August and 99 cents at the end of 2007, according to index data compiled by New York-based Merrill Lynch & Co.
…
“The de-leveraging that we’re witnessing will probably continue,” said Paul Scanlon, team leader for U.S. high yield and bank loans at Boston-based Putnam Investments LLC, which manages $55 billion in fixed income. “My sense is that’s not turning around in the very near term.”
I am not very familiar with the bond market but it does seem like the panic is in full swing but calling the bottom is always hard. I would guess the de-leveraging (and investors pulling money out of bond funds) could well lead things lower over the short term.
Related: Corporate and Government Bond Rates Graph – Municipal Bonds After Tax Return
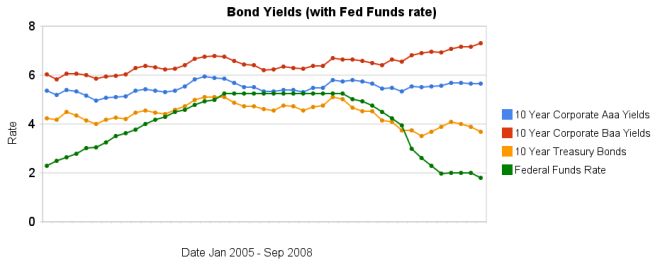
Over the last 3 months the yields on corporate bonds have increased while treasury bonds have decreased. The chart shows the move away from lower quality bonds to higher quality though probably not as dramatically as actually has taken place as it is just an average for each month (and in September the flight to quality became extreme at the end of the month). While the Fed did not announce a formal cut in the discount rate, the average rate for overnight loans from the Fed last month was 1.81%.
The spread between 10 year Aaa corporate bond yields and 10 year government bonds increased to 196 basis points. In January, 2008 the spread was 159 points. The larger the spread the more people demand in interest, to compensate for the increased risk. The spread between government bonds and Baa corporate bonds increased to 362 basis points, the spread was 280 basis point in January. The rate on government bonds has barely change (decreasing from 3.74% in January to 3.69% now) so the change has nearly all been in increased corporate bond rates.
Data from the federal reserve – corporate Aaa – corporate Baa – ten year treasury – fed funds
Related: Bond Yields 2005 to June 2008 – 30 Year Fixed Mortgage Rates versus the Fed Funds Rate – Curious Cat Investing and Economics Search – posts on interest rates
On Wednesday of last week the United States 3 month treasury bill yield reached .03%, yet another remarkable chart from the current crisis.
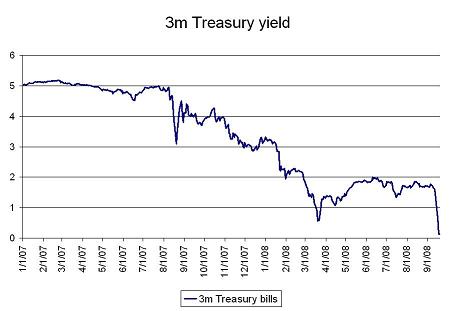
via: No one wants to hold risk … – “I guess this is what a close to systemic financial crisis in the US looks like”
Daily Treasury Yield Rates show that the rate for Friday the 12th of September 1.49%, Monday the 15th 1.02%, Tuesday .84%, Wednesday .03%, Thursday .23% and Friday .99%.
Related: Corporate and Government Bond Yields – Curious Cat Investing and Economics Search – Credit Crisis Continues (April 2008)
Fannie Mae (the quasi government mortgage giant) is raising fees for mortgages it buys. Banks and mortgage lenders often sell the mortgage to Fannie Mae shortly after completing the loan. Mortgages get more expensive – again
And Fannie doubled its “adverse market delivery charge” to 0.5%. That is an across-the-board fee assessed against every loan Fannie buys, according to a Fannie spokeswoman. Fannie first instituted the charge this spring.
…
The added fees will be passed on to borrowers and could mean quarter-point increases in interest rates.
…
Fannie will also eliminate buying Alt-A loans by the end of 2008. Alt-A loans, a category between prime and subprime, accounted for about 11% of the company’s loans during the last years of the boom. They have been used mostly by people who couldn’t or wouldn’t document their incomes, their assets or both. These buyers will find it harder to obtain financing once Fannie stops buying the loans.
According to Yun, however, the cutback in Alt-A will hurt people buying second homes to rent out or resell, rather than first time homeowners. “These are people who often rely on their good credit to buy investment properties putting little or no money down,” he said.
Related: Mortgage Rates Rising – Fed Funds Rate Changes Don’t Indicate Mortgage Rate Changes – Jumbo and Regular Mortgage Rates By Credit Score – Homes Entering Foreclosure at Record
I commented on, WaMu Free Checking: The High 3.3% APY May Be Worth A Look, yesterday:
I agree it is worth considering. It has FDIC insurance. But the bank is not very stable. The stock price, for example, was above 40 in the last year. It is below 5 now. But as long as your entire deposit is covered by FDIC you are in safe (though if a bank goes under – not that likely – there can be a delay in getting your money). Normally a bank’s assets would be bought out by another bank.
And today I read of the second largest bank failure in the history of the USA, IndyMac Bank seized by federal regulators:
Regulators said depositors would have no access to banking services online and by telephone this weekend, but could continue to use ATMs, debit cards and checks. Online banking and phone banking services are to resume operations Monday.
Federal authorities said based on a preliminary analysis, the takeover of IndyMac would cost the FDIC between $4 billion and $8 billion.
It is important to make sure your deposits are FDIC insured (in the USA), and to know the limits of the coverage.
FDIC Failed Bank Information Information for IndyMac Bank, F.S.B., Pasadena, CA
IndyMac was a huge mortgage focused bank. Their stock price had fallen from a high of nearly $30 in the last year to below $5 in April, $2 in May and $1 in June. It is a very good thing we have the FDIC.
Related: Credit Crisis (August 2007) – Credit Crisis Continues – Homes Entering Foreclosure at Record