Alphabet (Google) writes how they purchased 3.2 million shares this quarter in their earnings release:
In Q1 2016, we repurchased 3.2 million shares of Alphabet Class C capital stock for an aggregate amount of $2.3 billion, of which $2.1 billion was paid during the quarter. The total remaining authorization for future repurchases is approximately $1.4 billion. The authorization has no expiration date.
And they tout non-GAAP earnings, while of course reporting the GAAP earnings as required. One of the things executives like about non-GAAP earnings is they pretend the stock they give away to themselves doesn’t have a cost to shareholders. When you call attention to spending over $2 billion in the quarter to buy back 3.2 million shares it seems silly to then claim that the stock you gave away shouldn’t be considered as an expense.
How can you pay over $2 billion just to get back the stock you gave away and also pretend that money is not really a cost? And on top of that you promote the buyback as evidence that the stock is really worth more than you paid (after all why would you pay more than it is worth). But when you give the stock away to yourself that shouldn’t be seen as a cost? It is amazing they can do this and think they are not doing anything wrong.
And where does Google stand compared to last year for outstanding shares? 689,498,000 last year compared to 699,311,000 now. So nearly 10,000,000 more shares outstanding, even after they bought back 3.2 million this quarter. In the previous quarter there where 697,025,000 shares outstanding. All these figures are weighted-average diluted share balances for the entire quarter.
Google CEO, Sundar Pichai, got a $100 million stock award in 2015 (before being promoted to CEO). After the promotion he will be taking an additional “$209 million in stock granted every other year (he has to stay at Google for four years after each grant to cash them out).” He was granted $335 million in stock in 2014 and $78 million in 2013. You can see how quickly the executives paying themselves this well (this is 1 executive, a highly ranked one but still just 1) can dilute stockholders positions even with multi billion dollar buybacks in a quarter.
You don’t hear companies promoting how much dilution they are imposing on shareholders in order to provide windfalls for executives. I wonder why? No I don’t. I do wonder why reporters promote the buybacks and ignore the fact that the dilution is so extreme that it even overwhelms billions of dollars in buybacks.
Alphabet reported $6.02 a share in earnings and $7.50 a share in non-GAAP “earnings” for the latest quarter.
As I have said before I believe Google’s ability to extract enormous profit from their search dominance (as well as YouTube and adwords) makes it a very compelling long term investment. It would be better if the executives were not allowed to take such huge slices from the cash flow Google generates. But it is able to sustain those raids on stockholder equity and still be a good investment and appears likely to be able to continue to do so. Though I think they would be better off reducing the amount executives take going forward.
Related: Google Diluted Shareholder Equity by 1% a year (2009-2013) – Executives Again Treating Corporate Treasuries as Their Money (2011) – Another Year of CEO’s Taking Hugely Excessive Pay (2009) –
This post continues our series on peer-to-peer lending (and LendingClub): Peer to Peer Portfolio Returns and The Decline in Returns as Loans Age, Investing in Peer to Peer Loans. LendingClub, and other peer-to-peer lenders let you use filters to find loans that meet your criteria. So if you chose to take more, or less, risk you can use filters to find loans fitting your preferences. Those filters can also be applied to automate your lending.
There are resources online to help you understand the past results of various investing strategies (returns based on various filters). Some filter are just a trade-off of risk for return. You can invest in grade A (a LendingClub defined category) loans that have the lowest risk, and the lowest interest rates and historical returns. Or you can increase your risk and get loans with higher interest rates and also higher historical returns (after factoring in defaults).

Description of chart: This chart shows the historical performance by grade for all issued loans.
This chart includes all loans that were issued 18 months or more before the last day of the most recently completed quarter. The historical returns data in the chart is updated monthly.
Adjusted Net Annualized Return (“Adjusted NAR”) is a cumulative, annualized measure of the return on all of the money invested in loans over the life of those loans, with an adjustment for estimated future losses.
LendingClub lets you set filters to use to automatically invest in new loans as funds are available to invest (either you adding in new money or receiving payments on existing loans). This is a nice feature, there are items you can’t filter on however, such as job title. And also you can’t make trade-offs, say given x, y and z strong points and a nice interest rate in this loan I will accept a bit lower value on another factor.
So I find I have to be a bit less forgiving on the filter criteria and then manually make some judgements on other loans. For me I add a bit higher risk on my manual selections. I would imagine most people don’t bother with this, just using filters to do all the investing for them. And I think that is fine.
Practically what I do so that I can make some selections manually is to set the criteria to only be 98% invested. This will cause it to automatically invest any amount over 2% that is not invested. You can set this to whatever level you want and also is how you can make payments to yourself. I will say I think one of the lamest “features” of LendingClub is that is has no ability to send you regular monthly checks. So you have to manually deal with it.
It should be simple for them to let you set a value like send me $200 on the 15th of each month. And then it manages the re-investments knowing that and your outstanding loans. But they still don’t offer that feature.
As I said one of the factors in setting filters is managing risk v. reward but the other is really about weaknesses in the algorithm setting rates. You can just see it as risk-reward trade-off but I think it is more sensible to see 2 different things. The algorithm weaknesses are factors that will fluctuate over time as the algorithm and underwriting standards are improved. For example, loans in California had worse returns (according to every site I found accessing past results). There is no reason for this to be true. If a person with the exactly same profile is riskier in California that should be reflected in higher rates and thus bring the return into balance. My guess is this type of factor will be eliminated over time. But if not, or until it is, fixed filtering out loans to California makes sense.
Once you set your filter criteria then you select what balance you want between A, B, C, D, E and FG loans. I set mine to
A 2%
B 16%
C 50%
D 20%
E 10%
I actually have a bit over 1% in FG (but I select those myself). In 2015 the makeup of the loans given by LendingClub was A 17%, B 26%, C 28%, D 15%, E 10%, F and G 4%.
Related: Where to Invest for Yield Today (2010) – Default Rates on Loans by Credit Score – Investing in Stocks That Have Raised Dividends Consistently – Investment Risk Matters Most as Part of a Portfolio, Rather than in Isolation
Sadly Lending Club uses fragile coding practices that result in sections of the site not working sometimes. Using existing filters often fails for me – the code just does nothing (it doesn’t even bother to provide feedback to the user on what it is failing to do). Using fragile coding practices sadly is common for web sites with large budgets. Instead of using reliable code they seems to get infatuated with cute design ideas and don’t bother much making the code reliable. You can code the cute design ideas reliably but often they obviously are not concerned with the robustness of the code.
The 20 publicly traded companies with the largest market capitalizations. Since my October 2015 list of the 20 most valuable stocks many of the market caps have declined significantly.
| Company | Country | Market Capitalization | |
|---|---|---|---|
| 1 | Apple | USA | $541 billion |
| 2 | Alphabet (GOOGL) | USA | $496 billion |
| 3 | Microsoft | USA | $412 billion |
| 4 | Exxon Mobil | USA | $341 billion |
| 5 | Berkshire Hathaway | USA | $329 billion |
| 6 | USA | $311 billion | |
| 7 | GE | USA | $300 billion |
| 8 | Johnson & Johnson | USA | $296 billion |
| 9 | Amazon | USA | $262 billion |
| 10 | Wells Fargo | USA | $245 billion |
Apple lost $131 billion in market cap since my October post. Alphabet (Google) lost just $1 billion in market cap, and for a short time moved past Apple into the top stop. Facebook achieved a rare increase during this period, gaining $16 billion and moving up 1 spot on the list. All the top 10 most valuable companies are based in the USA once again.
The next ten most valuable companies:
| Company | Country | Market Capitalization | |
|---|---|---|---|
| 11 | Nestle | Switzerland | $226 billion |
| 12 | Roche | Switzerland | $226 billion |
| 13 | China Mobile | China | $219 billion |
| 14 | Walmart | USA | $216 billion |
| 15 | JPMorgan Chase | USA | $214 billion |
| 16 | Procter & Gamble | USA | $211 billion |
| 17 | Verizon | USA | $209 billion |
| 18 | Industrial & Commercial Bank of China | China | $206 billion* |
| 19 | Novartis | Switzerland | $195 billion |
| 20 | Petro China | China | $191 billion |
Market capitalization shown are of the close of business February 26th, as shown on Google Finance.
The 11th to 20th most valuable companies includes 4 USA companies, 3 Chinese companies and 3 Swiss companies. Toyota fell from 20th to 25th and was replaced in the top 20 by Verizon, which resulted in the USA gaining 1 company and costing Japan their only company in the top 20. Pfizer also dropped out and was replaced by Walmart.
The total value of the top 20 decreased by $189 billion since my October post: from $6.054 trillion to $5.865 trillion. Since my October 2014 post of the 20 most valuable companies in the world the total value of the top 20 companies has risen from $5.722 trillion to $5.865 trillion, an increase of $143 billion. The companies making up the top 20 has changed in each period.
Related: Global Stock Market Capitalization from 2000 to 2012 – Stock Market Capitalization by Country from 1990 to 2010 – Historical Stock Returns
A few other companies of interest (based on their market capitalization):
Read more
It has been over 10 years since I originally posted my 10 stocks for 10 years portfolio. 7 of those 10 are still in my portfolio for the next 10 years.
Since April of 2005, the portfolio Marketocracy calculated annualized rate or return is 7.1% (the S&P 500 annualized return for the period is 6.9%). Marketocracy subtracts the equivalent of 2% of assets annually to simulate management fees – as though the portfolio were a mutual fund. Without that fee, the return beats the S&P 500 annual return by about 220 basis points annually (9.1% to 6.9%).
Since the last update, I have added Gilead to the portfolio. I also dropped PetroChina and Templeton Dragon fund (as I had mentioned I would do).
The current stocks, in order of return:
| Stock | Current Return | % of sleep well portfolio now | % of the portfolio if I were buying today | |
|---|---|---|---|---|
| Amazon – AMZN | 736% | 12% | 9% | |
| Google – GOOG | 400%* | 21% | 15% | |
| Danaher – DHR | 129% | 8% | 8% | |
| Apple – AAPL | 85% | 17% | 17% | |
| Toyota – TM | 50% | 8% | 10% | |
| Intel – INTC | 46% | 7% | 8% | |
| Pfizer – PFE | 21% | 6% | 6% | |
| Cisco – CSCO | 14% | 3% | 3% | |
| Abbvie – ABBV | 1% | 6% | 8% | |
| Gilead – GILD | -6% | 6% | 8% | |
| Cash | – | 6% | 8% |
The current marketocracy results can be seen on the Sleep Well marketocracy portfolio page.
Related: 12 Stocks for 10 Years, Jan 2014 Update – 12 Stocks for 10 Years – 12 Stocks for 10 Years: January 2012 Update – October 2012 Update – 12 Stocks for 10 Years, Oct 2010 Update
I make some adjustments to the stock holdings over time (selling of buying a bit of the stocks depending on large price movements – this rebalances and also lets me sell a bit if I think things are getting highly priced. So I have sold some Amazon and Google as they have increased greatly (and I have added to ABBV and GILD at nice prices). These purchases and sales are fairly small (resulting in an annual turnover rate under 2%).
I would consider selling Cicso. I also would like to find a good natural resource stock or two if I can find good stocks. I do feel the portfolio is too concentrated in technology and medical stocks so I am would choose a stock with a different focus if it were close to as good as an alternative focused on technology or health care, but I will also buy great companies at good prices even if that results in a less diverse portfolio.
I don’t try and sell significant portions of the portfolio and have a large cash balance to time the market. I will, however, sell some of the individual positions if I think the price is very high (or to rebalance the portfolio a bit).
The market has gone down a fair amount recently and may go down more. It may be in that downdraft I will find a nice candidate to add at an attractive price.
If you wonder why the Apple return isn’t higher, I debated adding it at the outset but decided against it. So I only started adding Apple in 2010 and added to that position over the next several years.
* Marketocracy seems to have messed up the returns for Google (probably due to the split); this is sad as their purpose for me is to calculate returns, but my guess is between 350-450%
The most popular posts on the Curious Cat Investing and Economics blog in 2014 (by page views).
- Top 10 Countries for Manufacturing Production in 2010: China, USA, Japan, Germany… (posted in 2011)
- Manufacturing Output as a Percent of GDP by Country (1980 to 2008) (2010)
- Nuclear Power Generation by Country from 1985-2010 (2012)
- Government Debt as Percentage of GDP 1990-2009: USA, Japan, Germany, China… (2010)
- Stock Market Capitalization by Country from 1990 to 2010 (2012)
- Global Stock Market Capitalization from 2000 to 2012 (2013)
- The 20 Most Valuable Companies in the World – October 2015
- Manufacturing Output as Percent of GDP from 1980 to 2010 by Country (2012)
- USA Individual Earnings Levels: Top 1% $343,000, 5% $154,000, 10% $112,000, 25% $66,000 (2012)
- Manufacturing Output by Country 1999-2011: China, USA, Japan, Germany (2013)
- Chart of Largest Petroleum Consuming Countries from 1980 to 2010 (2011)
- The USA Doesn’t Understand that the 1950s and 1960s are Not a Reasonable Basis for Setting Expectations (2011)
- Oil Production by Country 1999-2009 (2011)
- Monopolies and Oligopolies do not a Free Market Make (2008)
- Investing in Peer to Peer Loans (2015)
- Cockroach Portfolio (2014)
- USA Health Care Spending 2013: $2.9 trillion $9,255 per person and 17.4% of GDP (2015) (
- Long Term View of Manufacturing Employment in the USA (2012)
- Solar Energy Capacity by Country (2015)
- Chart of Global Wind Energy Capacity by Country 2005 to 2013 (2014)
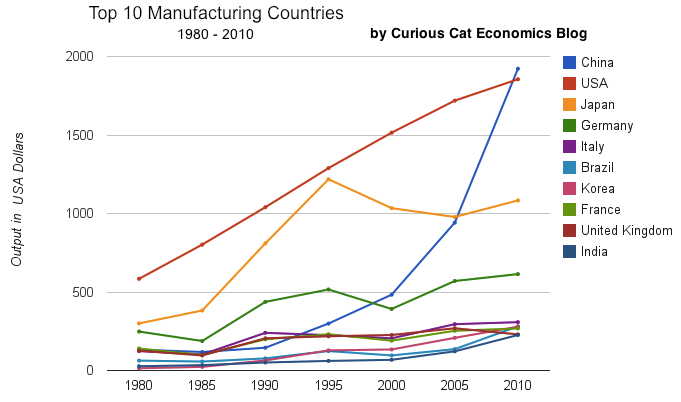
chart of output by top 10 manufacturing countries from 1980 to 2010
As with my other blogs the most popular posts show that old posts stay popular for a long time. Number of top 20 posts by year of publication:
2015: 4
2014: 2
2013: 2
2012: 5
2011: 4
2010: 2
2008: 1
Related: 20 Most Popular Posts on the Curious Cat Investing and Economics Blog in 2014 – 20 Most Popular Post on Curious Cat Science and Engineering Blog in 2014 – 10 Most Popular Posts on the Curious Cat Management Blog in 2014 – Most Popular Posts on the Curious Cat Management Comments Blog – Most Popular Posts on the Curious Cat Comments Blog
Today there are more ways to invest your money than ever before. Alternative investments can help provide counterweights to more common investments.
Historical documents are important pieces of cultural memorabilia that are sought after by personal collectors, museums and universities. Given the prestige of the collectors, historical documents can go for top dollar. In one recent example, Bill Gates purchased the Codex Leicester for over $30 million.
Historical documents can be a great addition to any portfolio, but one word of caution: authenticity is critical. Far too many investors have been bamboozled by counterfeit documents. Raab Collection, an internationally recognized proprietor of historical documents, stresses the importance of due diligence. When they help clients such as the Library of Congress build their collections, every step possible is taken to authenticate a document before striking a deal.
Here are four other factors that should be considered before making your first historical document investment:
Plan for Preservation
The older historical documents get the more valuable they become – as long as they are properly preserved. The condition of the document is second only to authenticity when it comes to value.
Before you take ownership of a historical document, it’s a good idea to have a plan in place for how the document will be stored. Documents should be kept in waterproof, airtight containers that protect the fibers from the elements. UV radiation can also degrade paper overtime, which is why storing historic documents out of direct sunlight is always advised.
Protecting Your Investment
Unlike stocks and mutual funds, physical assets can be destroyed or stolen. Historical documents have to be treated like fine art. They should be insured and some form of theft protection should be put in place. Documents can be stored in a fireproof lockbox and/or stored in a bank safe under lock and key.
Get Documents Appraised
Professional appraisals are important for historical collectables. An appraisal will give you an official estimate of the value, which can be used for securing insurance. Appraisals also give you a better idea of an acceptable price when it comes time to sell off your investment.
Keep Track of the Market and Trends
You won’t be checking stats daily like the stock market, but keeping up with historical document sales is needed to ensure you make the best decisions for your investment. After all, making money on investments hinges on knowing when to buy and when to sell. Knowing what’s happening in the market will help you determine when the time is ripe to sell or whether you should hold onto your asset a little longer. Demand for historical documents tends to be higher than supply, but catching things right when interest is trending upward can help you make the most profit possible.
Historical and autographed documents have always been popular collectibles, but now more people are beginning to realize their investment potential. Every year countless documents are sold privately and at auction for thousands and even millions of dollars. Investors that seek professional guidance before buying and take care to preserve their asset will be able to grow their portfolio or retirement nest egg by simply holding on to a piece of history.
In general alternative investments (historical documents, art, coins, collectibles etc.) should make up a small portion, under 5%, of an investment portfolio. Another investment that isn’t quite normal, but isn’t really considered a normal investment either is peer to peer loans. We have written about peer to peer loans several times on this blog recently, I would consider under 5% for peer to peer loans acceptable but would consider that part of the bond portion of a portfolio.
Peer to peer lending has grown dramatically the last few years in the USA. The largest platforms are Lending Club (you get a $25 bonus if you sign up with this link – I don’t think I get anything?) and Prosper. I finally tried out Lending Club starting about 6 months ago. The idea is very simple, you buy fractional portions of personal loans. The loans are largely to consolidate debts and also for things such as a home improvement, major purchase, health care, etc.).
With each loan you may lend as little as $25. Lending Club (and Prosper) deal with all the underwriting, collecting payments etc.. Lending Club takes 1% of payments as a fee charged to the lenders (they also take fees from the borrowers).
Borrowers can make prepayments without penalty. Lending Club waives the 1% fee on prepayments made in the first year. This may seem a minor point, and it is really, but a bit less minor than I would have guessed. I have had 2% of loans prepaid with only an average of 3 months holding time so far – much higher than I would have guessed.
On each loan you receive the payments (less a 1% fee to Lending Club) as they are made each month. Those payments include principle and interest.
This chart shows the historical performance by grade for all issued loans that were issued 18 months or more before the last day of the most recently completed quarter. Adjusted Net Annualized Return (“Adjusted NAR”) is a cumulative, annualized measure of the return on all of the money invested in loans over the life of those loans, with an adjustment for estimated future losses. From LendingClub web site Nov 2015, see their site for updated data.
Lending Club provides you a calculated interest rate based on your actual portfolio. This is nice but it is a bit overstated in that they calculate the rate based only on invested funds. So funds that are not allocated to a loan (while they earn no interest) are not factored in to your return (though they actually reduce your return). And even once funds are allocated the actual loan can take quite some time to be issued. Some are issued within a day but also I have had many take weeks to issue (and some will fail to issue after weeks of sitting idle). I wouldn’t be surprised if Lending Club doesn’t start considering funds invested until the loan is issued (which again would inflate your reported return compared to a real return), but I am not sure how Lending Club factors it in.
This chart shows that the percentage of millionaire families by highest education level is dramatically different by education level. The data is looking at USA family income for household headed by a person over 40. For high school dropouts, fewer than 1% are millionaires; all families it is about 5%; high school graduates about 6%; 4 year college degree about 22% and graduate or professional degree about 38%.

Interesting chart based on Federal Reserve data (via the Wall Street Journal)
While the costs of higher education in the USA have become crazy the evidence still suggests education is highly correlated to income. Numerous studies still show that the investment in education pays a high return. Of course, simple correlation isn’t sufficient to make that judgement but in other studies they have attempted to use more accurate measures of the value of education to life long earnings.
Related: The Time to Payback the Investment in a College Education in the USA Today is Nearly as Low as Ever, Surprisingly – Looking at the Value of Different College Degrees – Engineering Graduates Earned a Return on Their Investment In Education of 21%
The blog post with the chart, Why Wealth Inequality Is Way More Complicated Than Just Rich and Poor has other very interesting data. Go read the full post.
Average isn’t a very good measure for economic wealth data, is is skewed horribly by the extremely wealthy, median isn’t a perfect measure but it is much better. The post includes a chart of average wealth by age which is interesting though I think the $ amounts are largely worthless (due to average being so pointless). The interesting point is there is a pretty straight line climb to a maximum at 62 and then a decline that is about as rapid as the climb in wealth.
That decline is slow for a bit, dropping, but slowly until about 70 when it drops fairly quickly. It isn’t an amazing result but still interesting. It would be nice to see this with median levels and then averaged over a 20 year period. The chart they show tells the results for some point in time (it isn’t indicated) but doesn’t give you an idea if this is a consistent result over time or something special about the measurement at the time.
They also do have a chart showing absolute wealth data as median and average to show how distorted an average is. For example, median wealth for whites 55-64 and above 65 is about $280,000 and the average for both is about $1,000,000.
Related: Highest Paying Fields at Mid Career in USA: Engineering, Science and Math – Wealthiest 1% Continue Dramatic Gains Compared to Everyone Else – Correlation is Not Causation: “Fat is Catching” Theory Exposed
When you sell your primary residence in the USA you are able to exclude $250,000 in capital gains (or $500,000 if you file jointly). The primary test of whether it is your primary residence is if you lived there 2 of the last 5 years (see more details from the IRS). You can’t repeat this exemption for 2 years (I believe).
It doesn’t matter if you buy another house or not, that exclusion of up to $250,000 is all that can be excluded (you must pay tax on anything above that amount – taxed at capital gains rates for long term gains).

For investment property you can do 1031 exchanges which defers capital gains taxes. Otherwise capital gains will be taxed as you would expect (as capital gains).
When you inherit a house the tax basis will be “stepped up” to the current market rate. So if you then sell your basis isn’t what the owner paid for it, but what it was worth when it was given to you.
Related: Looking for Yields in Stocks and Real Estate – Your Home as an Investment – Home Values and Rental Rates
The 10 publicly traded companies with the largest market capitalizations. Since October of last year the top 20 list has seen quite a bit of profit for stockholders (mainly in Apple and Chinese companies).
| Company | Country | Market Capitalization | |
|---|---|---|---|
| 1 | Apple | USA | $741 billion |
| 2 | Microsoft | USA | $374 billion |
| 3 | USA | $370 billion | |
| 4 | Exxon Mobil | USA | $352 billion |
| 5 | Berkshire Hathaway | USA | $346 billion |
| 6 | China Mobile | China | $340 billion* |
| 7 | Industrial & Commercial Bank of China | China | $306 billion** |
| 8 | Wells Fargo | USA | $292 billion |
| 9 | GE | USA | $275 billion |
| 10 | Johnson & Johnson | USA | $273 billion |
Apple’s market cap is up $115 billion since the last list was created in October of 2014. That increase is more than 50% of the value of the 14th most valuable company in the world (in October 2014).
China Mobile increased $100 billion and moved into 6th place. Industrial and Commercial Bank of China (ICBC) increased $78 billion to move into 7th place.
Exxon Mobil lost over $50 billion (oil prices collapsed as OPEC decided to stop attempting to hold back supply in order to maximize the price of oil). Alibaba (the only non-USA company in the last list) and Walmart dropped out of the top 10.
The total value of the top 20 increased from $5.722 trillion to $6.046 trillion, an increase of $324 billion. Several companies have been replaced in the new top 20 list.
The next ten most valuable companies:
| Company | Country | Market Capitalization | |
|---|---|---|---|
| 11 | JPMorgan Chase | USA | $250 billion |
| 12 | China Construction Bank | China | $250 billion** |
| 13 | Novartis (NVS) | Switzerland | $246 billion |
| 14 | Petro China | China | $237 billion |
| 15 | Wal-Mart | USA | $236 billion |
| 16 | Tencent | China | $235 billion** |
| 17 | Nestle | Switzerland | $235 billion*** |
| 18 | USA | $231 billion | |
| 19 | Hoffmann-La Roche (ROG.VX) | Switzerland | $231 billion |
| 20 | Alibaba | China | $226 billion |
Market capitalization shown are of the close of business last Friday, as shown on Yahoo Finance.
The current top 10 includes 8 USA companies and 2 Chinese companies. The 11th to 20th most valuable companies includes 4 Chinese companies, 3 Swiss companies and 3 USA companies. Facebook (after increasing $21 billion), China Construction Bank (increasing $68 billion – it is hard for me to be sure what the value is, I am not sure I am reading the statements correctly but this is my best guess) and Tencent moved into the top 20; which dropped Procter & Gamble, Royal Dutch Shell and Chevron from the top 20.
Related: Historical Stock Returns – Global Stock Market Capitalization from 2000 to 2012 – Stock Market Capitalization by Country from 1990 to 2010 – Solar Energy Capacity by Country (2009-2013)
A few other companies of interest (based on their market capitalization):