Recently Greece and the huge USA federal deficits have highlighted the problem of excessive government debt. The above chart shows gross government debt by country from the IMF.
Korea has essentially no gross government debt (under 2% of GDP for the entire period). At the other end of the spectrum Japan has seen gross government debt rise to 197% (Japan’s 2008 figure is an IMF estimate). The IMF did not have data for Greece (which would likely look very bad) or China (which I would think would be very low – maybe even negative – the government having more assets than debt).
The USA debt stood at 64% in 1990, 71% in 1995, 55% in 2000, 61% in 2005 and 70% in 2008. Most countries are expected to see significant increases in 2009. The IMF sees the USA going to 85% in 2009 and 100% in 2012. They see Germany at 79% in 2009 and 90% in 2012. They See the UK at 69% in 2009 and 94% in 2012. They see Japan at 237% in 2012.
 The chart shows gross government debt as percentage GDP 1990-2008. By Curious Cat Investing and Economics Blog, Creative Commons Attribution.
___________________________
The data here is very similar to the OECD data I provided earlier, Government Debt Compared to GDP 1990 to 2007, though with some notable differences. In the OECD data was still in the best shape, but is seen as having 29% debt to GDP in 2007. The IMF data attempts to avoid issues where some countries have debt of non-federal governments that are hidden when looking just at federal government debt.
Data source: IMF data (for some countries the data is also from that site but at different urls).
Related: The Long-Term USA Federal Budget Outlook – USA, China and Japan Lead Manufacturing Output in 2008 – Oil Consumption by Country in 2007 – Saving Spurts as Spending Slashed
Once again the USA was the leading country in manufacturing in 2008. And once again China grew their manufacturing output amazingly. In a change with recent trends Japan grew output significantly. Of course, the 2009 data is going to show the impact of a very severe worldwide recession.
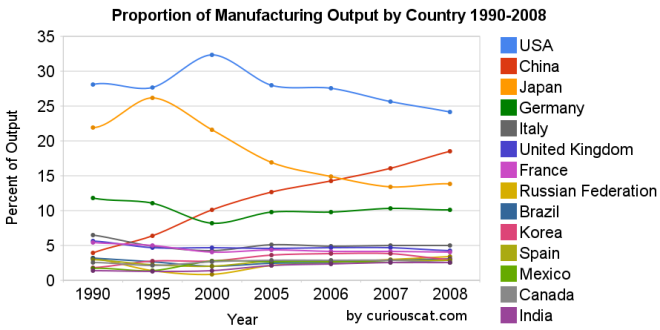 Chart showing the percentage output of top manufacturing countries from 1990-2008 by Curious Cat Management Blog, Creative Commons Attribution.
The first chart shows the USA’s share of the manufacturing output, of the countries that manufactured over $185 billion in 2008, at 28.1% in 1990, 27.7% in 1995, 32% in 2000, 28% in 2005, 28% in 2006, 26% in 2007 and 24% in 2008. China’s share has grown from 4% in 1990, 6% in 1995, 10% in 2000, 13% in 2005, 14% in 2006, 16% in 2007 to 18% in 2008. Japan’s share has fallen from 22% in 1990 to 14% in 2008. The USA has about 4.5% of the world population, China about 20%. See Curious Cat Investment blog post” Data on the Largest Manufacturing Countries in 2008.
Even with just this data, it is obvious the belief in a decades long steep decline in USA manufacturing is not in evidence. And, in fact the USA’s output has grown substantially over this period. It has just grown more slowly than that of China (as has every other country), and so while output in the USA has grown the percentage with China has shrunk. The percentage of manufacturing output by the USA (excluding output from China) was 29.3% in 1990 and 29.6% in 2008. The second chart shows manufacturing output over time.
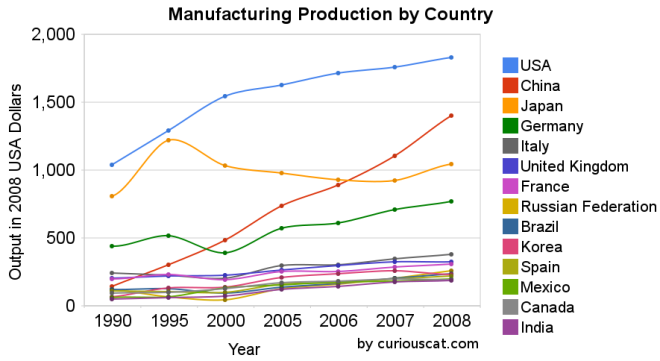 Chart showing the output of the top manufacturing countries from 1990-2008 by Curious Cat Management Blog, Creative Commons Attribution.
The 2008 China data is not provided for manufacturing alone (the latest UN Data, for global manufacturing, in billions of current USA dollars). The percentage of manufacturing (to manufacturing, mining and utilities) was 78% for 2005-2007 (I used 78% of the manufacturing, mining and utilities figure provided in the 2008 data). There is a good chance this overstates China manufacturing output in 2008 (due to very high commodity prices in 2008).
Hopefully these charts provide some evidence of what is really going on with global manufacturing and counteracts the hype, to some extent. Global economic data is not perfect. These figures are an attempt to capture the economic reality in the world but they are not a perfect proxy. This data is shown in 2008 USA dollars which is good in the sense that it shows all countries in the same light and we can compare the 1995 USA figure to 2005 without worrying about inflation. However foreign exchange fluctuations over time can show a country, for example, having a decline in manufacturing output in some year when in fact the output increased (just the decline against the USA dollar that year results in the data showing a decrease – which is accurate when measured in terms of USA dollars).
If the dollar declines substantially between when the 2008 data was calculated and the 2009 data is calculated that will give result in the data showing a substantial increase in those countries that had a currency strengthen against the USA dollar. At this time the Chinese Renminbi has not strengthened while most other currencies have – the Chinese government is retaining a peg to a specific exchange rate.
Korea (1.8% in 1990, 3% in 2008), Mexico (1.7% to 2.6%) and India (1.4% to 2.5%) were the only countries to increase their percentage of manufacturing output (other than China, of course, which grew from 3.9% to 18.5%).
Related: posts on manufacturing – Global Manufacturing Data by Country (2007) – Global Manufacturing Employment Data – 1979 to 2007 – Top 10 Manufacturing Countries 2006 – Top 10 Manufacturing Countries 2005
China has been growing incredibly quickly for years. The credit crisis slowed things down. But unlike so many other governments that spent all their resources and more in good times, China has plenty of cash and spent a great deal on large projects. That spending has boosted their economy. And with that encouragement their economy has continued to grow, including consumer spending. As I posted earlier, China May Take Car Sales Lead from USA in 2009.
China Raises GDP Growth Estimates, Narrowing Gap With Japan
…
China’s expansion in 2008 compares with U.S. growth of less than 1 percent. Japan’s gross domestic product shrank 1.2 percent. The Indian economy expanded 6.7 percent in the fiscal year ended March 2009.
Economic data always has some errors within, and from China the data is even less reliable. But the overall strength seem very real and significant.
Related: Government Debt Compared to GDP 1990-2007 – Japanese Economy Grew at 3.7% Annual Rate (Aug 2009)
With the dollar declining sharply, many are focused on the issue now. And the most common culprit for blame seems to be the federal debt. While I agree the dollar is likely to fall, the deficit doesn’t seem like the main reason, to me. The federal debt is large and growing quickly, which is a problem. But still the USA federal debt to GDP is lower than the OECD average. Even with a few more years of crazy federal debt growth the USA will still be below that average.
Japan has by far the highest level of government debt in the OECD. The Yen is not collapsing. The debt is a factor but the lack of saving (USA consuming more than it produces) seems the biggest problem to me. China not only does not have large government debt it has large amounts of personal savings. People have been living far within their means in Japan and China (only by government intervention, due to desires to not have the currency appreciate has that appreciation been slowed).
Thankfully we have been increasing savings a bit recently but it is a drop in the bucket so far (Consumer Debt Down Over $100 Billion So Far in 2009). It will have to increase in size and continue for years to begin to address the problems in a significant way.
Related: The USA Economy Needs to Reduce Personal and Government Debt (March 2009) – The Truth Behind China’s Currency Peg – Who Will Buy All the USA’s Debt?
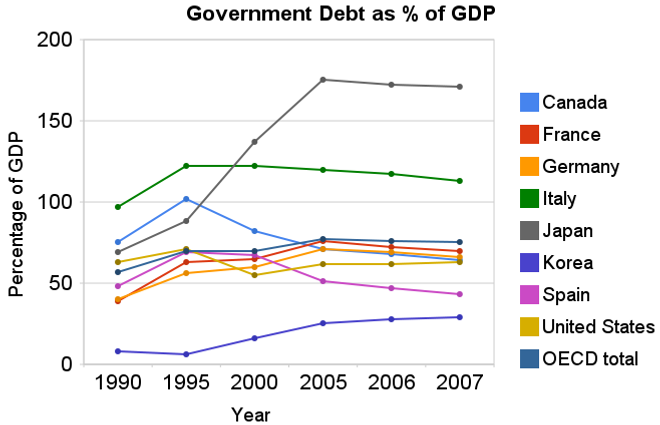 Chart showing government debt as a percentage of GDP by Curious Cat Investing Economics Blog, Creative Commons Attribution, data from OECD, Sept 2009.
For 2007 most countries slightly decreased their government debt to GDP ratio – as economic growth exceeded debt growth. The OECD is made up of countries in Europe and the USA, Japan, Korea, Australia, New Zealand and Canada. The overall OECD debt to GDP ratio decreased from 77% in 2005 to 75% in 2007. The USA moved in the opposite direction increasing from 62% to 63%: still remaining far below the OECD total. Most likely 2008, 2009 and 2010 will see both the USA and other OECD national dramatically increase the debt burden.
Compared to the OECD countries the USA is actually better than average. The chart shows the percentage of GDP that government debt represents for various countries. The USA ended 2007 at 63% while the overall OECD total is 75%. In 1990 the USA was at 63% and the OECD was at 57%. Japan is the line way at the top with a 2007 total of 171% (that is a big problem for them). Korea is in the best shape at just a 29% total in 2007 but that is an increase from just 8% in 1990.
Related: Government Debt as a Percentage of GDP Through 2006 – Oil Consumption by Country in 2007 – Federal Deficit To Double This Year – Politicians Again Raising Taxes On Your Children – True Level of USA Federal Deficit – Top 12 Manufacturing Countries in 2007
Read more
The largest oil consuming countries (and EU), in millions of barrels per day for 2007. China increased use by 1 billion barrels a day, the USA and Europe decreased use by 100 million barrels a day from our post last year on Oil Consumption by Country.
| Country | consumption | % of oil used | % of population | % of World GDP | % of oil used in 2006 |
|---|---|---|---|---|---|
| USA | 20.7 | 24.3 | 4.5 | 21.0 | 25.9 |
| European Union | 14.4 | 16.9 | 7.4 | 21.9 | 18.1 |
| China | 7.9 | 9.2 | 19.9 | 10.8 | 8.6 |
| Japan | 5.0 | 5.8 | 1.8 | 6.5 | 6.7 |
| India | 2.7 | 3.1 | 17.3 | 4.5 | 3.0 |
| Russia | 2.7 | 3.1 | 2.0 | 3.1 | 3.6 |
| Germany | 2.5 | 2.8 | 1.2 | 4.2 | 3.3 |
| Brazil | 2.4 | 2.7 | 2.9 | 2.8 | 2.6 |
| Canada | 2.4 | 2.7 | 0.4 | 1.9 | 2.9 |
| Mexico | 2.1 | 2.4 | 1.6 | 2.0 | 2.6 |
| South Korea | 2.1 | 2.4 | 0.7 | 1.8 | 2.7 |
Data is from CIA World Factbook 2009 (downloaded August 2009). GDP calculated using purchasing power parity from 2008 fact book with estimated 2007 data.
Related: Government Debt as a Percentage of GDP – Global Manufacturing Production by Country – Manufacturing Contracting Globally (March 2009)
On the heels of the Japanese economy shrinking at 12.7% rate 2 quarters ago, the Japanese economy grew at a 3.7% annual rate in the second quarter. Japan is the 2nd largest economy (after the USA). Japan’s economy leaves recession:
…
Japan is heavily reliant on its exports so growth overseas could bode well for its recovery.
…
The French and German economies both grew by 0.3% between April and June, bringing to an end recessions in Europe’s largest economies that have lasted a year. Analysts had not expected the data, suggesting recovery could be faster than previously expected.
And Hong Kong recorded growth of 3.3% in the three months from April to June. That data was also better than had been expected, with the government subsequently increasing its forecast for growth in the whole year.
The global economic recovery seems to be taking shape more quickly than anticipated. However, we are still far from in the clear. The risks to short term economic recovery are still great. And the largest long term economic problems for the USA (massive federal debt, huge consumer debt [both the government and the people living far beyond their means] and an very expensive and harmful health care system) have not been addressed. If we are very very lucky the increased saving rate in the last 6 months will continue but it is very questionable if that will continue.
Related: Manufacturing Employment Data, 1979 to 2007 – Government Debt as a Percentage of GDP – Politicians Again Raising Taxes On Your Children (Jan 2008)
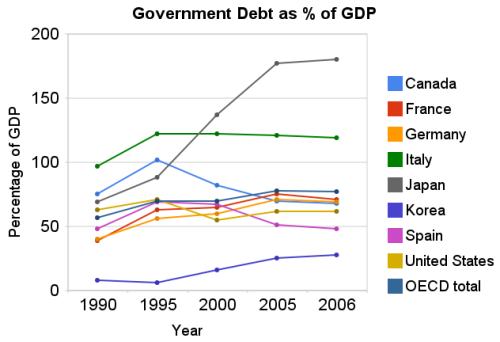 Chart showing government debt as a percentage of GDP by Curious Cat Investing Economics Blog, Creative Commons Attribution, data from OECD, March 2009.
The USA federal government debt is far too large, in my opinion. We have been raising taxes on future taxpayers for several decades, to finance our current spending. Within reason deficit spending is fine. What that reasonable level is however, is not easy to know. One big problem with the past few decades is that during very prosperous economic times we spent money that we didn’t have, choosing to raise taxes on the future (instead of either not spending as much or paying for what we were spending by raising taxes to pay for current spending).
By not even paying for what we are spending when times were prosperous we put ourselves in a bad situation when we have poor economic conditions – like today. If we were responsible during good economic times (and at least paid for what we spent) we could have reduced our debt as a percentage of GDP. Even if we did not pay down debt, just by not increasing the outstanding debt while the economy grew the ratio of debt to GDP would decline. Then when times were bad, we could afford to run deficits and perhaps bring the debt level up to some reasonable level (maybe 40% of GDP – though it is hard to know what the target should be, 40% seems within the realm of reason to me, for now).
There is at least one more point to remember, the figures in the chart are based on reported debt. The USA has huge liabilities that are not accounted for. So you must remember that the actually debt is much higher than reported in the official debt calculation.
Now on to the good news. As bad as the USA has been at spending tomorrows increases in taxes today, compared to the OECD countries we are actually better than average. The OECD is made up of countries in Europe, the USA, Japan, Korea, Australia, New Zealand and Canada. The chart shows the percentage of GDP that government debt represents for various countries. The USA ended 2006 at 62% while the overall OECD total is 77%. In 1990 the USA was at 63% and the OECD was at 57%. Japan is the line way at the top with a 2006 total of 180% (that is a big problem for them). Korea is in the best shape at just a 28% total in 2006 but that is an increase from just 8% in 1990.
Related: Federal Deficit To Double This Year – Politicians Again Raising Taxes On Your Children – True Level of USA Federal Deficit – Who Will Buy All the USA’s Debt? – Top 12 Manufacturing Countries in 2007 – Oil Consumption by Country
Read more
The Japanese economy shrank an amazing 12.7% in the fourth quarter of 2008. for comparison, the US economy fell by 3.8% in the quarter. Japan Economy Shrinks 12.7%, Steepest Drop Since 1974 Oil Shock
“There’s no doubt that the economy is in its worst state in the postwar period,” Economic and Fiscal Policy Minister Kaoru Yosano said in Tokyo. “The Japanese economy, which is heavily dependent on exports of autos, electronics and capital goods, has been severely hit by the global slowdown.”
…
Capital investment fell 5.3 percent. Manufacturers cut production by a record 11.9 percent in the quarter, indicating they have little need to buy equipment as factories lay idle. Consumer spending, which accounts for more than half of the economy, dropped 0.4 percent, as exporters fired workers.
…
The jobless rate surged to 4.4 percent in December from 3.9 percent, the biggest jump in four decades.
The decline is huge. Economies shrinking 2% is a large and fairly rare event. Shrinking over 10% is dramatically bad. The drop appears to be largely due to falling exports as consumer spending only dropped by .4 percent. Since 1930 the US economy has only fallen over 10% in a year 1932 and 1946. And real GDP has fallen over 2% only 5 times, the most recent time close to that large a fall was in 1982 with a 1.9% decline). Data from the United States Bureau of Economic Analysis. There is a good chance the US GDP will decline between 2-3% in 2009.
Related: Dreadful economic results in Japan suggest that things will only get gloomier – Over 500,000 Jobs Disappeared in November – Economic Fault: Income Inequality – Goldman Sachs Rakes In Profit in Credit Crisis (2007)
I have had difficulty finding good economic data on manufacturing jobs. I have posted about this previously but have trouble finding much worth posting about: Worldwide Manufacturing Job Data – Manufacturing Jobs. The Unites States Department of Labor, Bureau of Labor Statistics has published some interesting data and so here is a look at some of that data.
The table shows average annual productivity gains (output per hour, in USA dollars – I think it is not clear) – the 2007 output totals are from the United Nations data I posted about last week (Data on Top Manufacturing Countries).
| Average Annual Manufacturing Productivity Gains by Country | ||||||
|---|---|---|---|---|---|---|
| Country | 1979-1990 | 1990-1995 | 1995-2000 | 2000-2007 | 1979-2007 | 2007 Output $USA billion |
| Taiwan | 6.1 | 4.7 | 5.6 | 6.4 | 5.9 | |
| Korea | NA | 9.4 | 10.8 | 7.6 | NA | 241 |
| USA | 2.8 | 3.7 | 5.6 | 4.6 | 3.9 | 1,831 |
| France | 3.8 | 3.4 | 4.6 | 3.5 | 3.8 | 296 |
| Japan | 3.8 | 3.3 | 3.4 | 3.8 | 3.6 | 926 |
| United Kingdom | 4.1 | 2.8 | 2.7 | 3.9 | 3.6 | 342 |
| Germany | 2.1 | 2.9 | 3.7 | 3.8 | 3.0 | 670 |
| Spain | 3.3 | 3.1 | 0.8 | 2.1 | 2.5 | 208 |
| Canada | 2.1 | 3.4 | 3.8 | 1.1 | 2.4 | 218 |
| Italy | 3.4 | 3.8 | 1.4 | -.2 | 2.2 | 345 |
The countries that were part of the study but are not included in the table above: Australia, Belgium, Denmark, Netherlands, Norway, Sweden.
Manufacturing productivity increased in 14 of 16 countries in 2007, according to the study. The United States of America increase of 4.1 was the fourth largest among the 16 economies and was slightly above the 3.9 percent U.S. average annual increase since 1979. 15 of the 16 countries increased manufacturing output in 2007.
9 countries increased manufacturing hours worked in 2007, the USA increased 2.3% (below their average increase since 1979). Hours worked decreased for all countries in the period of 2000-2007 (UK has had the largest decrease 3.9% annual average decrease, the USA in next at 3.1%).
Manufacturing employment increased in 10 countries in 2007. From 2000-2007 the USA has experienced average annual declines of 3% in manufacturing employment (the second sharpest drop to the UK which has fallen 4%). From 1979-2007 the USA annual declines averaged 1.2% (only Taiwan.9% and Spain .1% showed increases). From 2000-2007 four countries show slight average annual increases: Spain .5%, Korea .4%, Taiwan .2% and Italy .2%. From 2000-2007 only 3 countries showed annual average decreases in output: Canada -.3%, Italy -.2% and UK – .1%.
Hourly manufacturing compensation has increased in all countries for the period 1979-2007 (data shown for this item is in each national currency: USA 4.6% average annual increases, Spain up 7.2% annually, Taiwan up 7%, UK 6.8%, Germany 4.4%, Japan 4.2%.
via: Canada’s Manufacturing Crisis in International Perspective
Related: posts on employment – Top 10 Manufacturing Countries 2006