We have written about the massive changes in manufacturing globally over the last few decades. As we have shown, the data shows that the USA remained the largest manufacturer until 2010 when China finally took over as the largest.
The massive declines in manufacturing employment were global. It led many to believe jobs were moving from the USA to China but much more accurately jobs were being eliminated everywhere. China lost more manufacturing jobs than the USA during the 1990s and early 2000s.
The manufacturing job losses have been caused by productivity improvements. And those productivity improvements have provided us much cheaper access to manufacturing goods. That continued downward pressure on prices has been a big factor in the drastic decline in inflation. The threat of excessive inflation, which was so feared in the 1980s, has been replaced by the opposite problem – the threat of deflation.
One aspect of the productivity improvement has been the global supply chains that have allowed companies to increase efficiency. The requirements of managing global supply chains are extremely complex and likely would not be possible without software to aid in the complex task.
In his book, The Great Convergence, Richard Baldwin discussed how important the decline in shipping costs had in the economics of the last 50 years (we wrote about this book in: Historical Global Economic Data and Current Issues for Globalization). Those declines in prices, aided by other factors, increased the importance of supply chains.
The last few decades have also seen dramatic changes in supply chains due to the internet. The time from manufacture to consumer has been shaved by direct shipment to consumers and nearly direct shipment to consumers via companies such as Amazon. Again software plays a central role in tying the manufacturing floor to a nearly instantaneous status of incoming orders from end users. Or in the case of software and entertainment, companies like Apple and Netflix have replaced the entire supply chain of manufacturing physical goods (DVDs, CDs…) with software.
These changes in addition to increasing efficiency are again decreasing jobs by increasing the efficiency of the economy. These changes cause harm to those that are being squeezed (both employees and companies) while the economy overall gets more goods at lower prices to consumers.
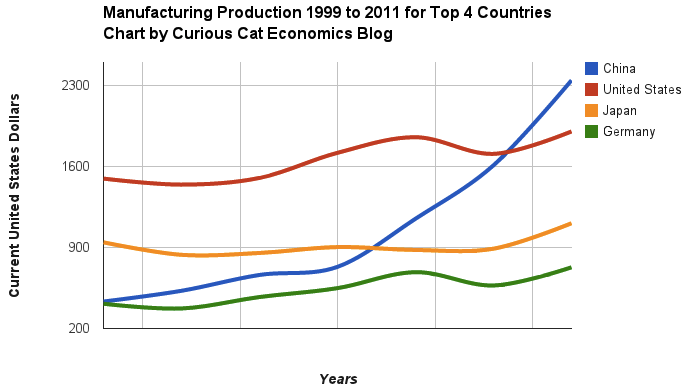
Chart of manufacturing production by China, USA, Japan and Germany from 1999 to 2011. The chart was created by the Curious Cat Economics Blog using UN data. You may use the chart with attribution. All data is shown in current USD (United States Dollar).
The story of global manufacturing production continues to be China’s growth, which is the conventional wisdom. The conventional wisdom however is not correct in the belief that the USA has failed. China shot past the USA, which dropped into 2nd place, but the USA still manufactures a great deal and has continually increased output (though very slowly in the last few years).
The story is pretty much the same as I have been writing for 8 years now. The biggest difference in that story is just that China actually finally moved into 1st place in 2010 and, maybe, the slowing of the USA growth in output (if that continues, I think the USA growth will improve). I said last year, that I expected China to build on the lead it finally took, and they did so. I expect that to continue, but I also wouldn’t be surprised to see China’s momentum slow (especially a few more years out – it may not slow for 3 or 4 more years).
As before, the four leading nations for manufacturing production remain solidly ahead of all the rest. Korea and Italy had manufacturing output of $313 billion in 2011 and Brazil moved up to $308 are in 4-6 place. Those 3 countries together could be in 4th place (ahead of just Germany). Even adding Korea and Italy together the total is short of Germany by $103 in 2011). I would expect Korea and Brazil to grow manufacturing output substantially more than Italy in the next 5 years.
Manufacturing employment is on a long term decline, in the USA and the world. The massive increases in productivity allow fewer and fewer people to produce more and more good. This is a good thing as it allows us to afford more good with less cost. But it does mean fewer manufacturing jobs, which are very good jobs, exist. This is a shame but something we shouldn’t anticipate changing. Believing we will globally, or in the USA, return to the huge number of manufacturing that were available previously jobs is not a wise conclusion to reach. Certainly there can be short term fluctuations that lead to increased jobs – that has happened in the last year for example.
")
The most surprising thing to me about this graph is how stable employment was through 2000. From 1980 to 2000 the most common idea was the USA no longer manufactured anything. This idea was wrong, as I have written about previously: Chart of top 15 countries manufacturing output over time (2009) – Top 10 manufacturing countries in 2006. But I did think employment declined more from 1970 to 2000.
One factor in this perception is that the number of employed people in the USA has continued to grow. So even remaining somewhat stable from 1970 to 2000, as a percentage of the labor force the jobs kept shrinking. The more important factor that played on people emotionally is factories being shut down got much more attention in the news than new jobs being added. So the perception was tons of jobs were being lost and none were being gained.
The largest manufacturing countries are China, USA, Japan and then Germany. These 4 are far in the lead, and very firmly in their positions. Only the USA and China are close, and the momentum of China is likely moving it quickly ahead – even with their current struggles.
The chart below shows manufacturing production by country as a percent of GDP of the 10 countries that manufacture the most. China has over 30% of the GDP from manufacturing, though the GDP share fell dramatically from 2005 and is solidly in the lead.
Nearly every country is decreasing the percentage of their economic output from manufacturing. Korea is the only exception, in this group. I would expect Korea to start following the general trend. Also China has reduced less than others, I expect China will also move toward the trend shown by the others (from 2005 to 2010 they certainly did).
For the 10 largest manufacturing countries in 2010, the overall manufacturing GDP percentage was 24.9% of GDP in 1980 and dropped to 17.7% in 2010. The point often missed by those looking at their country is most of these countries are growing manufacturing, they are just growing the rest of their economy more rapidly. It isn’t accurate to see this as a decline of manufacturing. It is manufacturing growing more slowly than (information technology, health care, etc.).

This chart shows manufacturing output, as percent of GDP, by country and was created by the Curious Cat Economics Blog based on UN data. You may use the chart with attribution.
The manufacturing share of the USA economy dropped from 21% in 1980 to 18% in 1990, 15% in 2000 and 13% in 2010. Still, as previous posts show, the USA manufacturing output has grown substantially: over 300% since 1980, and 175% since 1990. The proportion of manufacturing output by the USA (for the top 10 manufacturers) has declined from 33% in 1980, 32% in 1990, 35% in 2000 to 26% in 2010. If you exclude China, the USA was 36% of the manufacturing output of these 10 countries in 1980 and 36% in 2010. China’s share grew from 7.5% to 27% during that period.
The United Kingdom has seen manufacturing fall all the way to 10% of GDP, manufacturing little more than they did 15 years ago. Japan is the only other country growing manufacturing so slowly (but Japan has one of the highest proportion of GDP from manufacturing – at 20%). Japan manufactures very well actually, the costs are very high and so they have challenges but they have continued to manufacture quite a bit, even if they are not growing output much.
3 Economic Misconceptions That Need to Die
…
Just 6.4% of nondurable goods — things like food, clothing and toys — purchased in the U.S. are made in China; 76.2% are made in America. For durable goods — things like cars and furniture — 12% are made in China; 66.6% are made in America.
Those numbers are significantly less than I expected but the concept matches my understanding – that we greatly underestimate the purchasing of USA goods and services.
We have an inflated notion of how large the China macro economic numbers are for the USA (both debt and manufacturing exports to us). The China growth in both is still amazingly large: we just overestimate the totals today. We also forget that 25 years ago both numbers (imports from China and USA government debt owned by China) were close to 0.
We also greatly underestimate how much manufacturing the USA does, as I have been writing about for years. In fact, until 2010, the USA manufactured more than China.
Who owns the rest? The largest holder of U.S. debt is the federal government itself. Various government trust funds like the Social Security trust fund own about $4.4 trillion worth of Treasury securities. The Federal Reserve owns another $1.6 trillion.
Ok, this figure is a bit misleading. But even if you thrown out the accounting games 1.13/8.9 = 12.7%. That is a great deal. But it isn’t a majority of the debt or anything remotely close. Other foreign investors own $3.5 trillion trillion in federal debt (Japan $1 trillion, UK $500 billion). The $4.6 trillion of federal debt owned by foreigners is a huge problem. With investors getting paid so little for that debt though it isn’t one now. But it is a huge potential problem. If interest reates increase it will be a huge transfer of wealth from the USA to others.
The oil figure is a bit less meaningful, I think. Oil import are hugely fungible. The USA cutting back Middle East imports and pushing up imports from Canada, Mexico, Nigeria… doesn’t change the importance of Middle East oil to the USA in reality (the data might seem to suggest that but it is misleading due to the fungible nature of oil trading). Whether we get it directly from the Middle East or not our demand (and imports) creates more demand for Middle East oil. It is true the USA has greatly increased domestic production recently (and actually decreased the use of oil in 2009). So while I believe the data on Middle East oil I think that it is a bit misleading. If we had 0 direct imports from there we would still be greatly dependent on Middle East oil (because if France and China and India… were not getting their oil there they would buy it where we buy ours… Still the USA uses far more oil than any other country and is extremely dependent on imports. Several other countries are also extremely dependent on oil imports, including the next two top oil consuming countries: China, Japan.
Related: Oil Production by Country 1999-2009 – Government Debt as Percentage of GDP 1990-2009: USA, Japan, Germany, China… – Manufacturing Output as a Percent of GDP by Country – The Relative Economic Position of the USA is Likely to Decline
Total nonfarm payroll employment rose by 243,000 in January, and the unemployment rate decreased to 8.3%, the United States Bureau of Labor Statistics reported today. Job growth was widespread in the private sector (which gained 257,000 jobs in the month), with large employment gains in professional and business services, leisure and hospitality, and manufacturing (which added an impressive 50,000 jobs). The change in total nonfarm payroll employment for November was revised from +100,000 to +157,000, and the change for December was revised from +200,000 to +203,000 which brings the total number of jobs gained with this report to 303,000, a very impressive figure.
This employment news is really starting to add up to something good. And this is going on while everyone is worrying about the Euro imploding. Quite remarkable really. Avoiding a much worse result from the too big-to-fail-financial-firms credit crisis is surprising. We are not close to through the mess that we created, but that it hasn’t been much worse is fairly amazing. And that things are going so well now (even with large unemployment problems) is impressive. The huge government debt balances are a very large concern but it wouldn’t be surprising to have those same huge debts and much worse present day conditions (which would add to the debts).
The unemployment rate declined to 8.3%; the rate has fallen by 80 basis point since August. The number of unemployed persons declined to 12.8 million in January. Among the major worker groups, the unemployment rates for adult men (7.7%) and blacks (13.6%) declined in January. The unemployment rates for adult women (7.7%), teenagers (23.2%), whites (7.4%), and Hispanics (10.5%) were little changed. The jobless rate for Asians was 6.7%.
The number of long-term unemployed (those jobless for 27 weeks or more) was little changed at 5.5 million and accounted for 42.9% of the unemployed. Long term unemployment remains a big problem. With a few more months with such strong growth in jobs and that could start to change.
After accounting for the annual adjustments to the population controls, the employment-population ratio (58.5%) rose in January, while the civilian labor force participation rate held at 63.7%.
Professional and business services continued to add jobs in January (+70,000). About half of the increase occurred in employment services (+33,000). Job gains also occurred in accounting and bookkeeping (+13,000) and in architectural and engineering services (+7,000).
Related: USA Adds 216,00 Jobs in March and the Unemployment Rate Stands at 8.8% (March 2011) – USA Unemployment Rate Remains at 9.7% (Feb 2010) – USA Unemployment Rate Rises to 8.1%, Highest Level Since 1983 (March 2009)

Chart of manufacturing production by the top 10 manufacturing countries (2000 to 2010). The chart was created by the Curious Cat Economics Blog. You may use the chart with attribution. All data is shown in 2010 USD (United States Dollar).
In my last post I looked at the output of the top 10 manufacturing countries with a focus on 1980 to 2010. Here I take a closer look at the last 10 years.
In 2010, China took the lead as the world’s leading manufacturing country from the USA. In 1995 the USA was actually very close to losing the lead to Japan (though you wouldn’t think it looking at the recent data). I believe China will be different, I believe China is going to build on their lead. As I discussed in the last post the data doesn’t support any decline in Chinese manufacturing (or significant moves away from China toward other South-East Asian countries). Indonesia has grown quickly (and have the most manufacturing production, of those discussed), but their total manufacturing output is less than China grew by per year for the last 5 years.
The four largest countries are pretty solidly in their positions now: the order will likely be China, USA, Japan, Germany for 10 years (or longer): though I could always be surprised. In the last decade China relentlessly moved past the other 3, to move from 4th to 1st. Other than that though, those 3 only strengthened their position against their nearest competitors. Brazil, Korea or India would need to increase production quite rapidly to catch Germany sooner. After the first 4 though the situation is very fluid.
")
Taking a closure look at the large group of countries after top 4. Chart of manufacturing production from 2000-2010.
Chart of manufacturing production by the leading manufacturing countries (2000 to 2010). The top 4 countries are left off to look more closely at history of the next group. The chart was created by the Curious Cat Economics Blog based on UN data. You may use the chart with attribution.
Removing the top 4 to take a close look at the data on the other largest manufacturing countries we see that there are many countries bunched together. It is still hard to see, but if you look closely, you can make out that some countries are growing well, for example: Brazil, India and Indonesia. Other countries (most in Europe, as well as Mexico) did not fare well in the last decade.
The UK had a particularly bad decade, moving from first place in this group (5th in the world) to 5th in this group and likely to be passed by India in 2011. Europe has 4 countries in this list (if you exclude Russia) and they do not appear likely to do particularly well in the next decade, in my opinion. I would certainly expect Brazil, India, Korea and Indonesia to out produce Italy, France, UK and Spain in 2020. In 2010 the total was $976 billion by the European 4 to $961 billion by the non-European 4. In 2000 it was $718 billion for the European 4 to $343 billion (remember all the data is in 2010 USD).

Chart of output by top 10 manufacturing countries from 1980 to 2010. The chart was created by the Curious Cat Economics Blog based on UN data. You may use the chart with attribution.
China has finally actually taken the lead as the largest manufacturer in the world. Reading many news sources and blogs you may have thought the USA lost the lead a couple of decades ago, but you would be wrong. In 1995 it looked like Japan was poised to take the lead in manufacturing production, but they have slumped since then (still they are solidly the 3rd biggest manufacturer). China has been growing manufacturing output enormously for 20 years, and they have now taken the lead from the USA.
As I have been saying for years the biggest economic story about manufacturing is the dramatic and long term increase of productive capacity in China. The next is the continuing global decline in manufacturing employment: increased productivity has seen production rise year after year and employment fall. What is the next most interesting stories is debatable: I would say the continuing failure to appreciate the continuing strong manufacturing production increases by the USA. Another candidate is the the decline in Japan. Another is the increase in several other counties: Korea, Brazil, India, Indonesia…
Looking more closely at some of the long term data shows how much China stands out. From 1980 to 2010 China increased output 1345%. The total top 10 group increased output 302% (all data is in current USD so inflation accounts for most of the gain, 100 1980-USD equal 280 2010-USD). From 1995 to 2010 China increased output 543%. The group increased 64%. For 1980-2010, the results for the other 3 largest manufacturing countries are: USA up 218%, Japan up 261% and Germany up 148% (other countries doing very well are Korea up 1893% and India up 737%). Looking at the last half of that period, from 1995-2010 the: USA up 44%, Japan down 11% and Germany up 19%.
One thing to remember about adjusting manufacturing data for inflation is that often the products created in later years are superior and cost less. So that a computer manufactured in 1990 which added $5,000 to the manufacturing total is far inferior to one in 2010 that added just $1,000. This point is mainly to say that while the increase in manufacturing in real (not inflated dollars) is not as high as it might seem the real value of manufacturing good did likely increase a great deal. But the economic data is based on price so manufacturing increases are reduced by cost decreases. Computers are the most obvious example, but it is also true with many other manufactured goods.
You can that the other largest manufacturing countries fail to keep up with the increases of the entire group of the top 10. China’s gains are just too large for others to match. If you remove China’s results (just to compare how the non-China countries are doing) from 1980-2010 the increase was 216% (so compared to the other 9 top manufacturers over this period the USA was even and Japan better than the average and Germany was worse). And from 1995-2010 the top 9 group (top 10, less China) increased just 28%: so the USA beat while Japan and Germany did worse than the other 9 as a group.
I try to find global economic data on manufacturing and manufacturing jobs, but it isn’t easy. This is one of the areas I will be working on with the time I have freed up by moving to Malaysia (and taking a “sabbatical” [it isn’t really a sabbatical, I guess, just me studying and working on what I want to instead of what someone pays me to]).
I found some interesting data from the USA census bureau on manufacturing employment in several countries (it would be interesting to see the data for more countries but for now I am limited to this data). Sadly they just use indexed data (I would rather see raw data). This data for example lets you see the changes in countries but I don’t see any way to compare the absolute values between countries – all you can compare is the changes between countries.
The data is all indexed at 2002 = 100. Interestingly the USA has increased output per hour much more than any other country since 2002. The USA index stands at 146, the next highest is Sweden at 127 then the UK at 120. Italy is the only country tracked that fell since 2002, to 94. Japan (the 3rd largest manufacturer and 2nd largest of the countries include, China isn’t included) only increased to 113. Germany (4th and 3rd) increased to 111.
The data also lets you look back from 1990 to 2002 and again the USA has increased productivity very well (2nd most) – the value in 1990 was 58. Sweden actually had the largest gain from 1990-2002, rising from 49. In 1990 Japan stood at 71 and Germany 70.
An increasing number of news articles are reporting on the increasing strength of manufacturing in the USA (and globally, actually).
After years of American companies shipping jobs and contracts overseas, some are choosing local manufacturers or even “re-shoring” – bringing those jobs and work back to the United States.
…
One-fourth of more than 850 companies surveyed by MFG.com, a global online marketplace for manufacturers looking to source custom parts, returned work to North America from overseas in the last quarter of 2010.
The “decrease” in manufacturing in the USA has been exaggerated as I written for year (manufacturing has grown steadily over the last few decades in the USA). It is true though manufacturing in some plants has moved overseas. Over the last few years more and more stories report on American companies moving manufacturing back to the USA that they had moved offshore previously.
The Institute for Supply Management most recent survey reports a surge in US manufacturing to its highest reading in nearly seven years.
Related: Manufacturing Cars in the USA – Leading Manufacturing Countries Globally (1980-2009) – Global Manufacturing Employment Data – 1979 to 2007