 Chart showing loan delinquency rates for real estate, consumer and agricultural loans for 1998 to 2009 by the Curious Cat Investing Economics Blog, Creative Commons Attribution, data from the Federal Reserve.
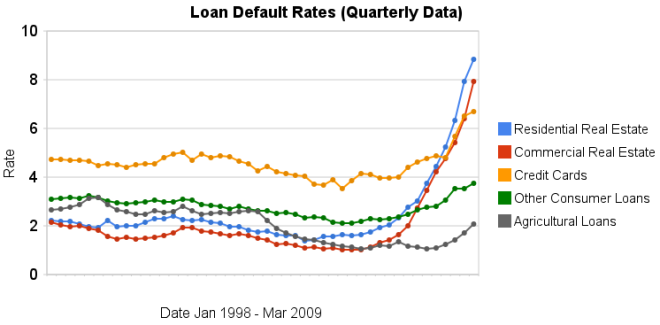
Delinquency rates on commercial (up another 151 basis points) and residential (93 basis points) real estate continued to increase dramatically in the second quarter. Credit card delinquency rates increased but only by 20 basis points.
Real estate delinquency rates exploded in 2008. In the 4th quarter of 2007 residential delinquency rates were 3.02% by the 4th quarter of 2008 they were 6.34% and in the 2nd quarter of this year they were 8.84% (582 basis points above the 4th quarter of 2007). Commercial real estate delinquency rates were at 2.74% in the 4th quarter of 2007, 5.43% in the fourth quarter of 2008 and 7.91% in the 2nd quarter of 2009 (a 517 basis point increase).
Credit card delinquency rates were much higher than real estate default rates for the last 10 years (the 4-5% range while real estate hovered above or below 2%). Now they are over 200 and 300 basis points bellow residential and commercial delinquency rates respectively. From 4.8% in the 3rd quarter 2008 to 5.66% in the 4th and 6.5% in the 1st quarter of 2009.
The delinquency rate on other consumer loans and agricultural loan delinquency rates are up but nowhere near the amounts of real estate or credit cards.
As I wrote recently bond yields in the last few months show a dramatic increase in investor confidence for corporate bonds.
Related: Loan Delinquency Rates: 1998-2009 – The Impact of Credit Scores and Jumbo Size on Mortgage Rates – 30 Year Mortgage Rate and Federal Funds Rate Chart
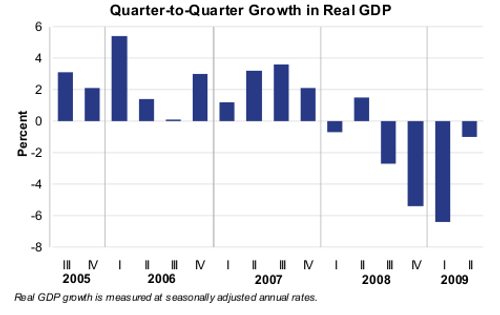 Chart from the Bureau of Economic Analysis showing the quarter to quarter growth in real GDP from 2005-2009.
Current-dollar GDP — the market value of the nation’s output of goods and services — decreased 1.0%, or $34.7 billion, in the second quarter to a level of $14,143.3 billion. In the first quarter, current-dollar GDP decreased 4.6%, or $169.3 billion.
More details on 2nd quarter, 2009 GDP.
Related: First Quarter GDP 2009 down 6.1% – Economists Raise Projections for Second Half of 2009 – What the Bailout and Stimulus Are and Are Not
The largest oil consuming countries (and EU), in millions of barrels per day for 2007. China increased use by 1 billion barrels a day, the USA and Europe decreased use by 100 million barrels a day from our post last year on Oil Consumption by Country.
| Country | consumption | % of oil used | % of population | % of World GDP | % of oil used in 2006 |
|---|---|---|---|---|---|
| USA | 20.7 | 24.3 | 4.5 | 21.0 | 25.9 |
| European Union | 14.4 | 16.9 | 7.4 | 21.9 | 18.1 |
| China | 7.9 | 9.2 | 19.9 | 10.8 | 8.6 |
| Japan | 5.0 | 5.8 | 1.8 | 6.5 | 6.7 |
| India | 2.7 | 3.1 | 17.3 | 4.5 | 3.0 |
| Russia | 2.7 | 3.1 | 2.0 | 3.1 | 3.6 |
| Germany | 2.5 | 2.8 | 1.2 | 4.2 | 3.3 |
| Brazil | 2.4 | 2.7 | 2.9 | 2.8 | 2.6 |
| Canada | 2.4 | 2.7 | 0.4 | 1.9 | 2.9 |
| Mexico | 2.1 | 2.4 | 1.6 | 2.0 | 2.6 |
| South Korea | 2.1 | 2.4 | 0.7 | 1.8 | 2.7 |
Data is from CIA World Factbook 2009 (downloaded August 2009). GDP calculated using purchasing power parity from 2008 fact book with estimated 2007 data.
Related: Government Debt as a Percentage of GDP – Global Manufacturing Production by Country – Manufacturing Contracting Globally (March 2009)
China’s recovery: Is it for real?
…
Investors don’t need to answer or even be interested in those philosophical questions. But they do need to consider the possibility that China’s huge acceleration in its growth rate is merely an artifact of the way the country keeps its books.
Economic data is often messy and confusing. The data itself often has measurement error. The actual aim is often not exactly what people think. And the data is often delayed so it provides a view of the situation, not today, but in the past and guesses must be made about what that says about today and the future.
And on top of those factors many countries feel significant internal pressures to report numbers that make the current economy look good. This is just another factor investor must consider when looking to make investments and evaluate economic conditions.
It seems to me the Chinese recovery does look real. How strong the economy will be 6 months from now is less clear but right now things look positive to me.
Related: posts on economic data – What Do Unemployment Stats Mean? – China Manufacturing Expands for the Fourth Straight Month (Jun 2009) – A Bull on China
The Greenback Effect by Warren Buffett
…
Because of this gigantic deficit, our country’s “net debt” (that is, the amount held publicly) is mushrooming. During this fiscal year, it will increase more than one percentage point per month, climbing to about 56 percent of G.D.P. from 41 percent. Admittedly, other countries, like Japan and Italy, have far higher ratios and no one can know the precise level of net debt to G.D.P.
…
Legislators will correctly perceive that either raising taxes or cutting expenditures will threaten their re-election. To avoid this fate, they can opt for high rates of inflation, which never require a recorded vote and cannot be attributed to a specific action that any elected official takes.
…
Our immediate problem is to get our country back on its feet and flourishing — “whatever it takes” still makes sense. Once recovery is gained, however, Congress must end the rise in the debt-to-G.D.P. ratio and keep our growth in obligations in line with our growth in resources.
Unchecked carbon emissions will likely cause icebergs to melt. Unchecked greenback emissions will certainly cause the purchasing power of currency to melt. The dollar’s destiny lies with Congress.
Related: Warren Buffett Webcast on the Credit Crisis – The Long-Term USA Federal Budget Outlook – Berkshire Hathaway Annual Meeting 2008 – Federal Reserve to Buy $1.2 Trillion in Bonds, Mortgage-Backed Securities
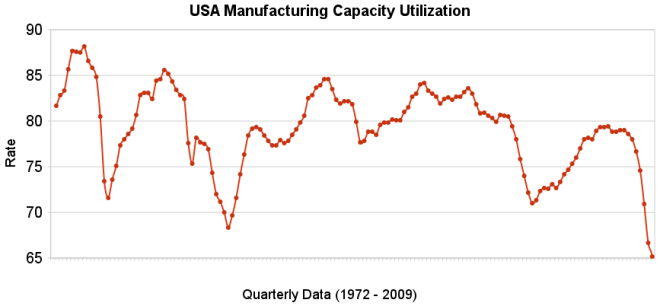 The chart shows the capacity utilization rate in the USA. By Curious Cat Investing Economics Blog, Creative Commons Attribution, data from the Federal Reserve.
Industrial production increased .5% in July and capacity utilization rate increased to 68.5% from an all time low of 68.1%. Capacity utilization has averaged 80.9% from 1972 to today.
Manufacturing output increased 1.0% in July but remained 14.4% lower than its year-earlier level. The factory operating rate rose to 65.4% in July, 70 basis points above the historical low recorded in June; the series begins in 1948. Production in durable goods industries advanced 2.2% in July. In addition to the sharp increase in motor vehicles and parts output, large production gains occurred for nonmetallic mineral products and for primary metals. The indexes for wood products, computer and electronic products, aerospace and miscellaneous transportation equipment, furniture and related products, and miscellaneous goods also rose. The indexes for fabricated metal products, machinery, and electrical equipment declined.
The production of nondurable goods fell 0.1% in July. The indexes for textile and product mills and for printing and support recorded sizable declines; the indexes for food, beverages, and tobacco and for petroleum and coal products also declined. The output of paper, of chemicals, and of plastic and rubber products increased.
The index for other manufacturing, which consists of publishing and logging, was down 0.6% in July.
The output of electric and gas utilities decreased 2.4%, and the operating rate for utilities dropped 21 basis points, to 77.6%. Mining production moved up 0.8%; its utilization rate in July, at 81.7%, was 59 basis points below its 1972-2008 average.
Data from the St. Louis Federal Reserve and Federal Reserve August 14th Industrial Production and Capacity Utilization press release.
Related: Loan Default Rates: 1998-2009 – Government Debt as a Percentage of GDP – USA Spent $2.2 Trillion, 16.2% of GDP, on Health Care in 2007
Read more
On the heels of the Japanese economy shrinking at 12.7% rate 2 quarters ago, the Japanese economy grew at a 3.7% annual rate in the second quarter. Japan is the 2nd largest economy (after the USA). Japan’s economy leaves recession:
…
Japan is heavily reliant on its exports so growth overseas could bode well for its recovery.
…
The French and German economies both grew by 0.3% between April and June, bringing to an end recessions in Europe’s largest economies that have lasted a year. Analysts had not expected the data, suggesting recovery could be faster than previously expected.
And Hong Kong recorded growth of 3.3% in the three months from April to June. That data was also better than had been expected, with the government subsequently increasing its forecast for growth in the whole year.
The global economic recovery seems to be taking shape more quickly than anticipated. However, we are still far from in the clear. The risks to short term economic recovery are still great. And the largest long term economic problems for the USA (massive federal debt, huge consumer debt [both the government and the people living far beyond their means] and an very expensive and harmful health care system) have not been addressed. If we are very very lucky the increased saving rate in the last 6 months will continue but it is very questionable if that will continue.
Related: Manufacturing Employment Data, 1979 to 2007 – Government Debt as a Percentage of GDP – Politicians Again Raising Taxes On Your Children (Jan 2008)
Ok, maybe moving to lower your cell phone bill would be a bit extreme. But the cost of cell phone service is almost 5 times as high in the USA as in Finland:
Mobile phone calls lowest in Finland, Netherlands and Sweden
Comparing prices on a medium-use basis for a package of 780 voice calls, 600 short texts (SMS), and eight multimedia (MMS) messages, the survey found monthly prices ranged from 11 to 53 US dollars across countries as of August 2008.
…
The OECD Communications Outlook says between 2006 and 2008 mobile phone call prices fell on average by 21% for low usage consumers, 28% for medium usage and by 32% for subscribers with the highest consumption patterns.
Related: Kiss Your Phone Bill Good-bye – money saving ideas – Investing dictionary
The behavior of banks is despicable enough when they are merely trying to trick educated, financially secure people out of their money. Banks charged $38.5 billion in fees last year according to the Financial Times. But that behavior, toward the poor, by banks (paying millions to hundreds of executives for, I guess, getting congress to send the companies billions) is immoral.
The Gates Foundation has decided to go into improving financial services for the poor. The are supporting micro-credit but also micro finance. Saving is key for poor people to get and stay out of poverty. Most already save money informally but want better, safer options. Setting aside money in a safe place will allow poor people to weather setbacks, build assets and financial security, and invest in opportunities for the next generation. Formal savings accounts also help them keep more of what they earn and easily access their money when they need it.
The poor need better banking options in poor countries. But the poor need better banking options in at least one rich country (the only one I know is the USA and banks in the USA provide lousy options for the poor). Credit Unions are much more likely to actually try and provide value to customers. Unfortunately banks in the USA seem to operate on the principle that customer are suckers that exist to pay for Porches for the children of bank executives.
Related: FDIC Study of Bank Overdraft Fees – Microfinancing Entrepreneurs – Incredibly Bad Customer Service from Discover Card – 10 Things Your Bank Won’t Tell You
Fed Focusing on Real-Estate Recession as Bernanke Convenes FOMC
…
Commercial property is “certainly going to be a significant drag” on growth, said Dean Maki, a former Fed researcher who is now chief U.S. economist in New York at Barclays Capital Inc., the investment-banking division of London-based Barclays Plc. “The bigger risk from it would be if it causes unexpected losses to financial firms that lead to another financial crisis.”
…
Any sales of mortgage-backed bonds would be the first new issues in the $700 billion U.S. market for commercial-mortgage- backed securities since it was shut down by the credit freeze in 2008. About $3 billion are in the pipeline, and the success of these sales may foster as much as $25 billion in total deals in the next six months
…
Forty-seven percent of loans at the 7,000-plus smaller U.S. lenders are in commercial real estate, compared with 17 percent for the biggest banks…
Related: Data Shows Subprime Mortgages Were Failing Years Before the Crisis Hit – Home Values and Rental Rates – Record Home Price Declines (Sep 2008)