I like charity that provides leveraged impact. I like charity that is aimed at building long term improvement. I like entrepreneurship. I like people having work they enjoy and can be proud of. And I like people having enough money for necessities and some treats and luxuries.
I think sites like oDesk provide a potentially great way for people to lead productive and rewarding lives. They allow people far from rich countries to tap into the market demand in rich counties. They also allow people to have flexible work arrangements (if someone wants a part time job or to work from home that is fine).
These benefits are also true in the USA and other rich countries (even geography – there are many parts of the USA without great job markets, especially many rural areas). The biggest problem with rich country residents succeeding on something like oDesk is they need quite a bit more money than people from other countries to get by (especially in the USA with health care being so messed up). There are a great deal of very successful technology people on oDesk (and even just freelancing in other ways), but it is still a small group that is capable and lucky enough to pull in large paychecks (it isn’t only technology but that is the majority of high paying jobs I think on oDesk).
But in poor countries with still easily 2 billion and probably much more there is a huge supply of good workers. There is a demand for work to be done. oDesk does a decent job of matching these two but that process could use a great deal of improvement.
I think if I became mega rich one of the projects I would have would be to create an organization to help facilitate those interested in internet based jobs in poor countries to make a living. It takes hard work. Very good communication is one big key to success (I have repeatedly had problems with capable people just not really able to do what was expected in communications). I think a support structure to help with that and with project management would be very good. Also to help with building skills.
If I were in a different place financially (and I were good at marketing which I am not) I would think about creating a company to do this profitably. The hard part for someone in a rich country to do this is that either they have to take very little (basically do it as charity) or they have to take so much cash off the top that I think it makes it hard to build the business.
But building successful organizations that can grow and provide good jobs to those without many opportunities but who are willing to work is something I value. I did since I was a kid living in Nigeria (for a year). I didn’t see this solution then but the idea of economic well being and good jobs and a strong economy being the key driver to better lives has always been my vision.
This contrast to many that see giving cash and good to those in need as good charity. I realize sometimes that is what is needed – especially in emergencies. But the real powerful change comes from strong economy providing people the opportunity to have a great job.
I share Dr. Deming’s personal aim was to advance commerce, prosperity and peace.
Related: Commerce Takes More People Out of Poverty Than Aid – Investing in the Poorest of the Poor – I am a big fan of helping improve the economic lives of those in the world by harnessing appropriate technology and capitalism – A nonprofit in Queens taught people to write iPhone apps — and their incomes jumped from $15k to $72k
Bono (who is fairly well known 🙂 as the lead singer for U2): “Commerce — entrepreneurial capitalism — takes more people out of poverty than aid, of course, we know that.”
That is my belief and something I believe in strongly. Real capitalism will bring people out of poverty. That isn’t the same thing as any businesses will do that. Businesses that use monopolistic powers to extract benefits to themselves and suppress free markets may well do more damage than good. But we will continue to bring more people out of poverty through economic development and capitalism than through aid.
Related: Helping Capitalism Make the World Better – Kiva – Giving Entrepreneurs an Opportunity to Succeed – Dr. Deming’s personal aim was to advance commerce, prosperity and peace – Business 901 Podcast with Me: Deming’s Management Ideas Today – Monopolies and Oligopolies do not a Free Market Make
The 12 stock for 10 years portfolio consists of stocks I would be comfortable putting into an IRA for 10 years. The main criteria is for companies with a history of large positive cash flow, that seemed likely to continue that trend. I am considering adding Abbot to the portfolio, and maybe dropping Cisco.
Since April of 2005 the portfolio Marketocracy* calculated annualized rate or return (which excludes Tesco) is 5.7% (the S&P 500 annualized return for the period is 3.9%). Marketocracy subtracts the equivalent of 2% of assets annually to simulate management fees – as though the portfolio were a mutual fund – so without that (it is not like this portfolio takes much management), the return beats the S&P 500 annual return by about 380 basis points annually (it would be a bit less with Tesco, but still close above 3%, I would think – calculating rates of return with purchases and sales and dividends is a complete pain, which is one reason Marketocracy is so nice).
The current stocks, in order of return:
| Stock | Current Return | % of sleep well portfolio now | % of the portfolio if I were buying today | |
|---|---|---|---|---|
| Amazon – AMZN | 350% | 9% | 7% | |
| Google – GOOG | 187% | 17% | 14% | |
| PetroChina – PTR | 115% | 8% | 6% | |
| Templeton Dragon Fund – TDF | 85% | 8% | 7% | |
| Templeton Emerging Market Fund – EMF | 44% | 5% | 7% | |
| Danaher – DHR | 43% | 10% | 10% | |
| Apple – AAPL | 42% | 9% | 9% | |
| Intel – INTC | 18% | 6% | 6% | |
| Cash (likely to be ABT soon) | – | 4% | 6% | |
| Cisco – CSCO | -2% | 5% | 4% | |
| Toyota – TM | -8% | 8% | 12% | |
| Pfizer – PFE | -9% | 6% | 7% | |
| Tesco – TSCDY | -13%** | 0%* | 5% |
The current marketocracy results can be seen on the Sleep Well marketocracy portfolio page.
Related: 12 Stocks for 10 Years: Feb 2011 Update – 12 Stocks for 10 Years, July 2011 Update – 12 Stocks for 10 Years, July 2009 Update – hand picked articles on investing
Read more
Trying to create significant supplementary income is not easy. There are lots of people selling get rich quick schemes and ways to earn big money for little effort. But those schemes don’t offer what they claim (they just don’t work for any, but a few people).
In trying to figure out a good way to create another income stream I thought of the idea of consulting over the internet in very small chunks of time. I explored the options to be a consultant that way and they were not good. But the idea seemed excellent to me and I worked with a friend to develop the idea of us creating such a online service. The potential was great I think. The end service would provide value to those seeking answers and those providing consultation (and to us).
We did get a domain and plan out the service and begin coding the application but didn’t progress very far. It was still a great idea and something I planned to consider if I had a bit more time. Well there is now an offering that appears to actually be fairly decent (on first glance): Minute Box.
Minute Box allows you several of the things we planned on offering (but not all of them – at least not yet). You can register as an expert and then be available for those wanting advice. You sign in when you are available to answer questions (and people can send you a note while you are offline). You set your rate. Essentially IM is used for consultation and the billing is taken care of by Minute Box.
One of the keys is matching people to experts well. Minute Box does one thing we planned on doing, which is to emphasize the experts tapping those that already value their advice. This would work very well for bloggers and those with an online presence and reputation.

I signed up and created my expert account, so if you want to get some advice from me you can get consulting by the minute from John Hunter.
I think this consulting by the minute model is a great way to create a secondary income stream for those that have a positive online reputation. You can adjust your pay to manage demand. If you have a free week and want to make some extra income you can reduce your rate and offer your readers a special discount. This is potentially a great way to capitalize on your expertise. I haven’t had much experience with Minute Box yet so it isn’t certain they are the answer (but I haven’t seen any other solution that is very good). And no matter the service provider used, I believe the internet enabled micro consulting is a great way to provide some extra income and make your personal finances more robust.
The range of advice you can offer is huge. For nearly anything there are people that need advice: how to cook thanksgiving dinner, helping a child with math homework, fashion advice, editing a resume, which mortgage offer is better in a specific situation, fixing a bug in a WordPress blog, what are good plants for a shady area… The list is nearly endless.
I wish I had been able to create a web site to facilitate this process. I believe the potential is huge. That is why I was so interested in making this idea work. It is the only web business I have seriously considered (and even started). I have numerous web sites but they involve providing content online not any software as service businesses.
Related: Earning More Money – Save Some of Each Raise – If you can’t pay cash, earn more money or save until you have the cash
This was a bad month for jobs in the USA. Not only did the U.S. Bureau of Labor Statistics report that the number of jobs remained at the same level as last month (125,000 additional jobs are needed for population growth, on average and we have huge losses from the credit crisis recession that have to be gained back) the last 2 months were revised down. The change in total nonfarm payroll employment for June was revised from
a gain of 46,000 to a gain of 20,000, and the July was revised down from gaining 117,000 job to gaining
85,000. That results in a total loss for this report of 58,000.
Still much better than the huge losses of several years ago but, along with the last few months, not a good sign for short term job growth. And the failure to address decades of favors given by politicians to too big to fail banks may actually create serious problems much sooner than most people feared. Pretty much everyone knew that the failure to address the main cause of the credit crisis was setting us up for again having the economy suffer huge blows due to the behavior of too big to fail institutions but I, and I think most people, thought it would be at least 5 years away and maybe even 10 before we had to seriously pay for the failures of our politicians to address this problem they (and their predecessors created).
It really seems like politicians don’t understand that their predecessors (decades ago) could afford to payoff large political donors and avoid dealing with problems and the enormous amount of wealth the economy was generating would let us prosper (even with lousy leadership), but that is no longer the case. The USA has used up huge economic advantages and that easy time is not coming back. Sadly the main hope for the USA is that other countries leaders create enough waste that the USA can remain competitive with all the waste our create (extremely lousy health care system, for example). It seems the American public doesn’t understand either, if anything we are electing even less intelligent and capable leaders today (over the last 10 years).
The USA has 14 million unemployed. Among the major worker groups, the unemployment rates for adult men was 8.9%, adult women 8.0% and teenagers 25.4%, whites. Of those 14 million the number of long-term unemployed (those jobless for 27 weeks and over) was about unchanged at 6 million in August.
The number of persons employed part time for economic reasons (sometimes referred to as involuntary part-time workers) rose from 8.4 million to 8.8 million in August. These individuals were working part time because their hours had been cut back or because they were unable to find a full-time job.
The average workweek for all employees on private nonfarm payrolls edged down by 0.1 hour over the month to 34.2 hours. The manufacturing workweek was 40.3 hours for the third consecutive month; factory overtime increased by 0.1 hour over the month to 3.2 hours. The average workweek for production and nonsupervisory employees on private nonfarm payrolls edged down to 33.5 hours in August, after holding at 33.6 hours for the prior 6 months.
As bad as this news is, it could be much worse. The economy is actually growing (very slowly), probably. Many companies are actually still very profitable (I am not counting companies that have fake profits with congress approved ability to report fake values for their assets – Congress granted their too big too fail donors, this, and many other favors while most others are left out in the cold). The wealth in the USA, even after we have been consuming our capital to live beyond what we earn each year (for decades) is still extremely high. This allows us to live well and invest even with many bad practices in place. We continue to have many excellent companies doing great work and providing great jobs. Even with all the problems in the USA there are few countries that are in as enviable an economic position. The biggest problem I see is we have been squandering those advantages far too easily and quickly for far too long. That leaves us much more economically venerable than we need to be.
Related: Paying Back Direct Cash Bailouts from Taxpayers Does not Excuse Bank Misdeeds – USA Unemployment Rate at 9.6% (after losing 54,000 job in Aug 2010)
Nonfarm payroll employment increased by 162,000 in March, and the unemployment rate held at 9.7%, based on U.S. Bureau of Labor Statistics surveys. Hiring for the census added 48,000 jobs in March, a large temporary increase, but less than expected amount, for the month. The change in total nonfarm payroll employment for January was revised from -26,000 to +14,000, and the change for February was revised from -36,000 to -14,000 together this results in an addition of 90,000 jobs.
The 162,000 added jobs is the largest increase since March of 2007. It is a good start but the economy will have to continue to increase the number of job added each month to reduce unemployment. Population growth requires an addition of approximately 125,000 jobs a month. The current labor pool has been temporarily reduced by those who have dropped out of the labor market. As jobs return they will come back into the market.
The economy has lost 8.2 million jobs since the recession started in December 2007. Now that was the bubble induced peak still, by the time the economy adds 8 million jobs many more jobs will be needed (since 125,000 additional jobs are needed each month). Still if we added 200,000 a month it would take 40 months to get back to the previous peak total. And by that time the economy would have accumulated another 9 million jobs needed (it would be about Dec 2013 = 6 * 12 months *125,000/month). While the bubble induced peak may well be a unrealistic target, the job market needs to add over 200,000 jobs a month to regain ground lost over the last several years.
In March, the number of unemployed persons was little changed at 15.0 million, and the unemployment rate remained at 9.7%. The number of long-term unemployed (those jobless for 27 weeks and over) increased by 414,000 over the month to 6.5 million. In March, 44.1% of unemployed persons were jobless for 27 weeks or more. Both are all time highs.
The civilian labor force participation rate (64.9%) and the employment-population ratio (58.6%) continued to edge up in March. The average length of unemployment rose to 31 weeks – the highest average ever (since 1948).
Related: USA Unemployment Rate Remains at 9.7% – 663,000 Jobs Lost in March, 2009 in the USA – Another 450,000 Jobs Lost in June, 2009 – Manufacturing Employment Data – 1979 to 2007
Read more
Once again the USA was the leading country in manufacturing in 2008. And once again China grew their manufacturing output amazingly. In a change with recent trends Japan grew output significantly. Of course, the 2009 data is going to show the impact of a very severe worldwide recession.
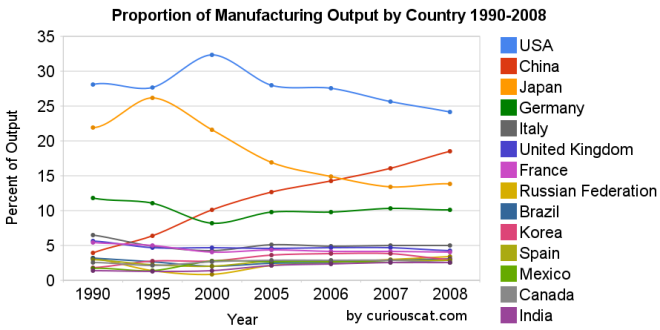 Chart showing the percentage output of top manufacturing countries from 1990-2008 by Curious Cat Management Blog, Creative Commons Attribution.
The first chart shows the USA’s share of the manufacturing output, of the countries that manufactured over $185 billion in 2008, at 28.1% in 1990, 27.7% in 1995, 32% in 2000, 28% in 2005, 28% in 2006, 26% in 2007 and 24% in 2008. China’s share has grown from 4% in 1990, 6% in 1995, 10% in 2000, 13% in 2005, 14% in 2006, 16% in 2007 to 18% in 2008. Japan’s share has fallen from 22% in 1990 to 14% in 2008. The USA has about 4.5% of the world population, China about 20%. See Curious Cat Investment blog post” Data on the Largest Manufacturing Countries in 2008.
Even with just this data, it is obvious the belief in a decades long steep decline in USA manufacturing is not in evidence. And, in fact the USA’s output has grown substantially over this period. It has just grown more slowly than that of China (as has every other country), and so while output in the USA has grown the percentage with China has shrunk. The percentage of manufacturing output by the USA (excluding output from China) was 29.3% in 1990 and 29.6% in 2008. The second chart shows manufacturing output over time.
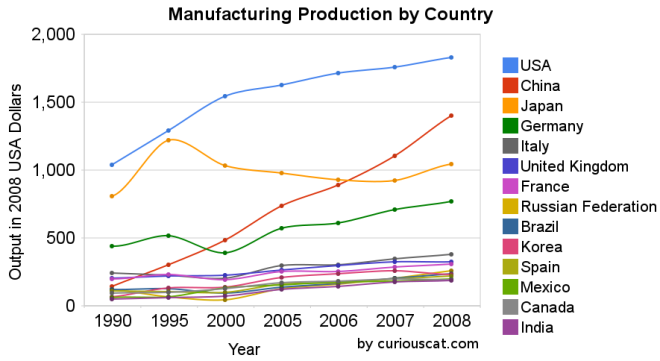 Chart showing the output of the top manufacturing countries from 1990-2008 by Curious Cat Management Blog, Creative Commons Attribution.
The 2008 China data is not provided for manufacturing alone (the latest UN Data, for global manufacturing, in billions of current USA dollars). The percentage of manufacturing (to manufacturing, mining and utilities) was 78% for 2005-2007 (I used 78% of the manufacturing, mining and utilities figure provided in the 2008 data). There is a good chance this overstates China manufacturing output in 2008 (due to very high commodity prices in 2008).
Hopefully these charts provide some evidence of what is really going on with global manufacturing and counteracts the hype, to some extent. Global economic data is not perfect. These figures are an attempt to capture the economic reality in the world but they are not a perfect proxy. This data is shown in 2008 USA dollars which is good in the sense that it shows all countries in the same light and we can compare the 1995 USA figure to 2005 without worrying about inflation. However foreign exchange fluctuations over time can show a country, for example, having a decline in manufacturing output in some year when in fact the output increased (just the decline against the USA dollar that year results in the data showing a decrease – which is accurate when measured in terms of USA dollars).
If the dollar declines substantially between when the 2008 data was calculated and the 2009 data is calculated that will give result in the data showing a substantial increase in those countries that had a currency strengthen against the USA dollar. At this time the Chinese Renminbi has not strengthened while most other currencies have – the Chinese government is retaining a peg to a specific exchange rate.
Korea (1.8% in 1990, 3% in 2008), Mexico (1.7% to 2.6%) and India (1.4% to 2.5%) were the only countries to increase their percentage of manufacturing output (other than China, of course, which grew from 3.9% to 18.5%).
Related: posts on manufacturing – Global Manufacturing Data by Country (2007) – Global Manufacturing Employment Data – 1979 to 2007 – Top 10 Manufacturing Countries 2006 – Top 10 Manufacturing Countries 2005
With the dollar declining sharply, many are focused on the issue now. And the most common culprit for blame seems to be the federal debt. While I agree the dollar is likely to fall, the deficit doesn’t seem like the main reason, to me. The federal debt is large and growing quickly, which is a problem. But still the USA federal debt to GDP is lower than the OECD average. Even with a few more years of crazy federal debt growth the USA will still be below that average.
Japan has by far the highest level of government debt in the OECD. The Yen is not collapsing. The debt is a factor but the lack of saving (USA consuming more than it produces) seems the biggest problem to me. China not only does not have large government debt it has large amounts of personal savings. People have been living far within their means in Japan and China (only by government intervention, due to desires to not have the currency appreciate has that appreciation been slowed).
Thankfully we have been increasing savings a bit recently but it is a drop in the bucket so far (Consumer Debt Down Over $100 Billion So Far in 2009). It will have to increase in size and continue for years to begin to address the problems in a significant way.
Related: The USA Economy Needs to Reduce Personal and Government Debt (March 2009) – The Truth Behind China’s Currency Peg – Who Will Buy All the USA’s Debt?
Manufacturing is an powerful driver of economic wealth. For years I have been providing data to counter the contention that the manufacturing base of the USA is gone and the little bit left was shrinking. The latest data again shows the USA is the largest manufacturer, and manufacturing in the USA continues to grow. It is true global manufacturing has begun to grow more rapidly than USA manufacturing in the last few years. I doubt many suspect that the USA’s share of manufacturing stayed stable from 1990 to 1995 then grew to 2000 took until 2006 to return to the 1990-1995 levels and then has declined in 2007 and 2008 a bit below the 1990 level and during that entire time was growing (even in 2007 and 2008).
The USA’s share of the manufacturing output, of the countries that manufactured over $185 billion in 2008, 28% in 1990, 28% in 1995, 32% in 2000, 28% in 2005, 28% in 2006, 26% in 2007 and 24% in 2008. China’s share has grown from 4% in 1990, 6% in 1995, 10% in 2000, 13% in 2005, 14% in 2006, 16% in 2007 to 18% in 2008. Japan’s share has fallen from 22% in 1990 to 14% in 2008 (after increasing to 26% in 1995 then steadily falling). The USA has about 4.5% of the world population, China about 20%.
Based on the latest UN Data, for global manufacturing, in billions of current US dollars:
| Country | 1990 | 1995 | 2000 | 2005 | 2006 | 2007 | 2008 |
|---|---|---|---|---|---|---|---|
| USA | 1,041 | 1,289 | 1,543 | 1,624 | 1,712 | 1,756 | 1,831 |
| China | 145 | 300 | 484 | 734* | 891* | 1,106* | 1,399** |
| Japan | 810 | 1,219 | 1,034 | 979 | 927 | 923 | 1,045 |
| Germany | 438 | 517 | 392 | 571 | 608 | 711 | 767 |
| Italy | 240 | 226 | 206 | 295 | 302 | 345 | 381 |
| United Kingdom | 206 | 218 | 226 | 264 | 295 | 323 | 323 |
| France | 200 | 233 | 190 | 255 | 255 | 287 | 306 |
| Russian Federation | 120 | 64 | 45 | 124 | 157 | 206 | 256 |
| Brazil | 120 | 125 | 96 | 137 | 163 | 201 | 237 |
| Korea | 66 | 131 | 136 | 211 | 234 | 260 | 231 |
| Spain | 112 | 104 | 98 | 160 | 170 | 196 | 222 |
| Mexico | 62 | 67 | 133 | 154 | 175 | 182 | 197 |
| Canada | 92 | 100 | 129 | 168 | 182 | 197 | 195 |
| India | 51 | 61 | 69 | 122 | 141 | 177 | 188 |
* I am using the data from last year that separated the manufacturing data (this year the data does not provide separate manufacturing data for China) instead of that shown in the most recent data (which doesn’t separate manufacturing)
** The China data is not provided for manufacturing alone. The percentage of manufacturing (to manufacturing, mining and utilities) was 78% for 2005-2007 (I used 78% of the manufacturing, mining and utilities figure provided in the 2008 data).
I hope to write a series of posts examining global manufacturing data including looking at manufacturing data specifically (excluding mining and utility data).
Read more
I like to buy stocks cheap and then hold them as they rise in price. This is not a unique desire, I know. One thing this lead me to do was find a stock I liked but hold off buying it until I could buy it for less. When that works it is great. However, one thing that happened several times is that I found stocks I really liked and they just went up and went up more and kept going up. And I never owned them.
I learned, after awhile, that is was ok to buy a stock at a higher price once I realized I made a mistake. Instead of just missing out because I made a mistake and didn’t buy it at a lower price than I needed to pay today (which made it feel really lame to buy it now at a higher price) I learned to accept that buying at the higher price available today was the best option.
I have seen two types of situations where this takes place: one I realize I was just way off, it was a great deal at the price I could have bought at – I just made a mistake. And if it was still a good buy, I should buy it. Another is that the stock price goes up but new news more than makes up for the increased stock price (the news makes the value of stock increase more than the price has increased).
I missed out on the Google IPO, even though I really wanted to buy. Then the price went way up and even though I had learned this (don’t avoid buying a stock today just because you made the mistake of not buying it at a lower price earlier) tip I wanted to buy it for less than the current price and so kept not buying it (emotion is a real factor in investing and that is another thing I have realized – you need to accept it and deal with it to be a good investor). Then Google announced spectacular earnings and it was finally enough to get me to buy the stock a few days later at $219 (which was well over twice the price 6 months earlier). But it was a great buy at $219 and losing that just because I should have bought it at $119 is not wise – but something I did many times in the past.
In March of 2009 I bought some ATPG at $3.20. In August I bought more at $11. The news was bit better but really it was just a huge huge bargain at $3.20 and I should have bought a lot more. In the last 5 trading days ATPG was up $5.12 (16.78 – 11.66). A nice gain. Right now, it is up another 68 cents today at $17.43. Now this is a volatile stock and until I sell it may not turn out to be profitable investment, but the odds are good that it will.
It is also hard to know when to sell – in fact for many selling at the wrong time (either selling too late – after it collapses [for good or sell it after a collapse only to see it recover], or too early missing out on huge gains) is the biggest problem they have in becoming a successful investor). One trait of many successful investors is holding the right investments for huge gains. A few stellar performances can lift the entire portfolio to long term investing success. And if you sell those stocks early you miss huge opportunities.
Holding on for the huge gains is a mistake I do not want to make – and so when the opportunity is there for such gains I am willing to risk losing some gains for the potential of a much larger gain. Right now the balance is keeping me from selling any ATPG, though I am likely to sell some if it increases (while continuing to hold some of the position).
Related: Great Google Earnings April 2007 – Nicolas Darvas (investor and speculator) – Not Every Day is Profitable – Does a Declining Stock Market Worry You? – 401(k)s are a Great Way to Save for Retirement – Beating the Market, Suckers Game? – Sleep Well Fund