Here is a good blog post showing one great feature of the blogosphere (that term seems to have fallen out of use hasn’t it): interaction. It also shows that you have to think critically. You can’t just accept what you read (you never can, but that is even more true with blogs than it is with newspapers that at least have some standards normally). I tend to agree with this posts look at the data, though I have not examined the issue closely.
Bad Math, Bad Statistics: Trying to get a blogger to admit a mistake
1981: 229465714 * 8476.0 = 1.944 trillion
1992: 255029699 * 14847.0 = 3.786 trillion (94% gain)
2005: 292892127 * 25036.0 = 7.332 trillion (93.6% gain)
Er, doesn’t look like a lag to me. In fact, it looks like it’s doubling every 12-13 years just as much as GDP is. I also looked up total income statistics for the US, and found the following figures (source). (Note these figures are different. More on that later.)
1981: $2,580,600,000 (2.58 / 3.1 = 83% of GDP)
1992: $5,349,384,000 (more than double!) (5.34 / 6.2 = 86% of GDP)
2005: $10,252,973,000 (another double!) (10.25 / 12.4 = 82% of GDP)
Anyway it is a much more interesting argument than I would hear when I listened to TV “pundits” years ago spout meaningless talking points at each other. Granted they argument is not going to be studied as a wonderful example of how we should debate. Still it is much above what passes for debate from our politicians (yes this is more a sad commentary on how failed our politicians are than a statement of how marvelous the argument on the GDP issue is between the two bloggers).
Here is a math question for you, what has a bigger impact moving from 15 to 18 mpg or 50 to 100 mpg?
Related: Government Debt as a Percentage of GDP – USA Consumers Paying Down Debt – Is Productivity Growth Bad? – Americans are Drowning in Debt
S&P 500 Payout Tops Bond Yield, a First Since 1958 (site broke the link, so I removed it):
…
Treasuries routinely had higher yields than stocks before 1958, according to Bernstein. When this relationship came to an end, yields were near their current levels. The S&P 500 dividend yield fell 0.58 percentage point, to 3.24 percent, in the third quarter of 1958. The 10-year yield rose about the same amount, 0.6 point, to 3.80 percent.
Two explanations later emerged for the reversal, he wrote. One held that the economy’s recovery from the 1957-58 recession showed “investors could finally put to rest the widely held expectation of an imminent return to the Great Depression.” The second was the increasing popularity of investing in growth stocks, or shares of companies whose sales and earnings rose at a relatively fast pace. Because of their expansion, the companies often paid below-average dividends.
Reversal of Fortunes Between Stocks and Bonds
Arnott takes it a step further. “In a world of deleveraging, both for the financial services arena and for the economy at large, growth is less certain,” he says. “And with the economy eroding sharply, so is inflation. If stocks don’t deliver nominal growth in dividends and earnings, then their yield ‘must’ exceed the Treasury yield, in order to give us any sort of risk premium.”
Related: Corporate and Government Bond Rates Graph – Highest Possible Returns – posts on interest rates – investing strategy
Singapore is again ranked first for Ease of Doing Business by the World Bank. For some reason they call the report issued in any given year as the report for the next year (which makes no sense to me). The data shown below is for the year they released the report.
| Country | 2008 | 2007 | 2006 | 2005 |
|---|---|---|---|---|
| Singapore | 1 | 1 | 1 | 2 |
| New Zealand | 2 | 2 | 2 | 1 |
| United States | 3 | 3 | 3 | 3 |
| Hong Kong | 4 | 4 | 5 | 6 |
| Denmark | 5 | 5 | 7 | 7 |
| United Kingdom | 6 | 6 | 6 | 5 |
| Ireland | 7 | 8 | 10 | 10 |
| Canada | 8 | 7 | 4 | 4 |
| other countries of interest | ||||
| Japan | 12 | 12 | 11 | 12 |
| Germany | 25 | 20 | 21 | 21 |
| France | 31 | 31 | 35 | 47 |
| Korea | 23 | 30 | 23 | 23 |
| Mexico | 56 | 44 | 43 | 62 |
| China | 83 | 83 | 93 | 108 |
| India | 122 | 120 | 134 | 138 |
| Brazil | 125 | 122 | 121 | 122 |
The rankings include ranking of various aspects of running a business. Some rankings for 2008: starting a business (New Zealand 1st, Singapore 10th, USA 6th, Japan 64th), Dealing with Construction Permits (St. Vincent and the Grenadines 1st, Singapore and New Zealand 2nd, USA 26th, China 176th), Employing Workers (Singapore and the USA 1st, Germany 142, Korea 152), protecting investors (New Zealand 1st, Singapore 2nd, Hong Kong 3rd, Malaysia 4th, USA 5th), enforcing contracts (Singapore 1, Hong Kong 2, USA 6, China 18), getting credit (Malaysia 1; UK and Hong Kong 2; Singapore, New Zealand and USA 5th), paying taxes (Maldives 1, Hong Kong 3, USA 46, Japan 112, China 132).
These rankings are not the final word on exactly where each country truly ranks but they do provide a valuable source of information. With this type of data there is plenty of room for judgment and issues with the data. Several of my posts, from my other blogs, that I recommend on this topic: The Future is Engineering, Science and Engineering in Global Economics Read more
The updated data from the United Nations on manufacturing output by country clearly shows the USA remains by far the largest manufacturer in the world. UN Data, in billions of current US dollars:
| Country | 1990 | 1995 | 2000 | 2005 | 2006 | 2007 |
|---|---|---|---|---|---|---|
| USA | 1,041 | 1,289 | 1,543 | 1,663 | 1,700 | 1,831 |
| China | 143 | 299 | 484 | 734 | 891 | 1,106 |
| Japan | 804 | 1,209 | 1.034 | 954 | 934 | 926 |
| Germany | 438 | 517 | 392 | 566 | 595 | 670 |
| Russian Federation | 211 | 104 | 73 | 222 | 281 | 362 |
| Italy | 240 | 226 | 206 | 289 | 299 | 345 |
| United Kingdom | 207 | 219 | 228 | 269 | 303 | 342 |
| France | 224 | 259 | 190 | 249 | 248 | 296 |
| Korea | 65 | 129 | 134 | 200 | 220 | 241 |
| Canada | 92 | 100 | 129 | 177 | 195 | 218 |
| Spain | 101 | 103 | 98 | 164 | 176 | 208 |
| Brazil | 120 | 125 | 96 | 137 | 170 | 206 |
| Additional countries of interest – not the next largest | ||||||
| India | 50 | 59 | 67 | 118 | 135 | 167 |
| Mexico | 50 | 55 | 107 | 122 | 136 | 144 |
| Indonesia | 29 | 60 | 46 | 80 | 102 | 121 |
| Turkey | 33 | 38 | 38 | 75 | 85 | 101 |
The USA’s share of the manufacturing output of the countries that manufactured over $200 billion in 2007 (the 12 countries on the top of the chart above) in 1990 was 28%, 1995 28%, 2000 33%, 2005 30%, 2006 28%, 2007 27%. China’s share has grown from 4% in 1990, 1995 7%, 2000 11%, 2005 13%, 2006 15%, 2007 16%.
Total manufacturing output in the USA was up 76% in 2007 from the 1990 level. Japan, the second largest manufacturer in 1990, and third today, has increased output 15% (the lowest of the top 12, France is next lowest at 32%) while China is up an amazing 673% (Korea is next at an increase of 271%).
Read more
Example 30 year mortgage rates (from myfico.com – see site for current rate estimates). Previous posts on this topic: Feb 2008 – August 2007 – May 2007. Since the last post both jumbo and conforming mortgages rates are up (and are up most for high credit scores).
| FICO score | APR Aug 2008 | APR Aug 2008 – jumbo | APR Feb 2008 | APR Feb 2008 – jumbo | APR Aug 2007 | APR May 2007 |
|---|---|---|---|---|---|---|
| 760-850 | 6.12% | 7.00% | 5.53% | 6.61% | 6.27% | 5.86% |
| 700-759 | 6.34% | 7.22% | 5.75% | 6.83% | 6.49% | 6.08% |
| 660-699 | 6.62% | 7.50% | 6.04% | 7.12% | 6.77% | 6.37% |
| 620-659 | 7.43% | 8.31% | 6.85% | 7.93% | 7.58% | 7.18% |
| 580-619 | 9.45% | 9.63% | 9.22% | 9.40% | 9.32% | 8.82% |
| 500-579 | 10.31% | 10.49% | 10.20% | 10.37% | 10.31% | 9.68% |
For scores above 620, the APRs above assume a mortgage with 1.0 points and 80% Loan-to-Value Ratio. For scores below 620, these APRs assume a mortgage with 0 points and 60 to 80% Loan-to-Value Ratio.
Since February the premium for jumbo loans has decreased to 88 basis points (from 108) for all credit scores above 620 (the combination of higher down payment and higher regular interest rates below 620 result in very little premium from Jumbo loans, under 20 basis points.
Related: 30 Year Fixed Rate Mortgage Rate Data – Learning About Mortgages – How Much Worse Can the Mortgage Crisis Get? – Real Free Credit Report (in USA)
The largest oil consuming countries (and EU), in millions of barrels per day:
| Country | consumption | % of oil used | % of population | % of World GDP |
|---|---|---|---|---|
| USA | 20.8 | 25.9 | 4.5 | 21.0 |
| European Union | 14.6 | 18.1 | 7.4 | 21.9 |
| China | 6.9 | 8.6 | 19.9 | 10.7 |
| Japan | 5.4 | 6.7 | 1.9 | 6.5 |
| Russia | 2.9 | 3.6 | 2.1 | 3.2 |
| Germany | 2.6 | 3.3 | 1.2 | 4.3 |
| India | 2.4 | 3.0 | 17.0 | 4.6 |
| Canada | 2.3 | 2.9 | 0.5 | 1.9 |
| Korea | 2.1 | 2.7 | 0.7 | 1.8 |
| Brazil | 2.1 | 2.6 | 2.9 | 2.8 |
| Mexico | 2.1 | 2.6 | 1.6 | 2.1 |
All data is from CIA World Factbook 2008 (downloaded Jun 2008). GDP calculated using purchasing power parity.
Related: Top 10 Manufacturing Countries 2006 – Country H-index Rank for Science Publications – Best Research University Rankings (2007)
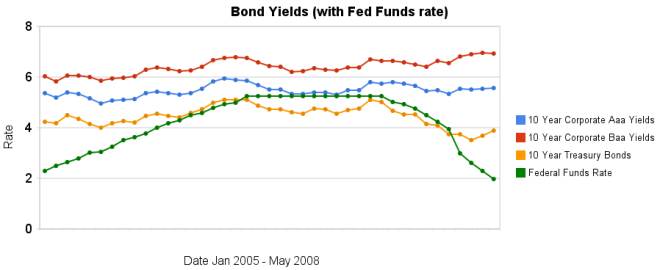
Over the last 2 months the yields on bonds have increased the discount rate has continued to decline.
The spread between corporate bond yields and government bonds has decreased a bit as treasury yields have increased 37 basis points compared to just 4 and 6 basis point increased in corporate bond yields.
Data from the federal reserve – corporate Aaa – corporate Baa – ten year treasury – fed funds
Related: Bond Yields 2005-2008 – 30 Year Fixed Mortgage Rates versus the Fed Funds Rate – Initial Retirement Account Allocations
I originally setup the 10 stocks for 10 years portfolio in April of 2005.
At this time the stocks in the sleep well portfolio in order of returns:
| Stock | Current Return | % of sleep well portfolio now | % of the portfolio if I were buying today | |
|---|---|---|---|---|
| Google – GOOG | 163% | 17% | 14% | |
| Amazon – AMZN | 124% | 7% | 7% | |
| PetroChina – PTR | 114% | 7% | 7% | |
| Templeton Dragon Fund – TDF | 90% | 10% | 10% | |
| Templeton Emerging Market Fund – EMF | 47% | 4% | 4% | |
| Cisco – CSCO | 42% | 7% | 8% | |
| Toyota – TM | 38% | 10% | 11% | |
| Tesco – TSCDY | 9% | 0% | 10% | |
| Intel – INTC | 3% | 5% | 6% | |
| Danaher – DHR | 1% | 5% | 8% | |
| Pfizer – PFE | -29% | 4% | 6% | |
| Dell | -30% | 7% | 6% |
At this point I am most positive on Google, Toyota, Templeton Dragon Fund and Tesco. I am wary of Dell – they seem to be moving in the wrong direction, but I am willing to give them longer to improve. I am even more wary of Prizer but again willing to stick with them for the long term. I will be looking for a suitable replacement.
In order to track performance I setup a marketocracy portfolio but had to make some minor adjustments. The current marketocracy calculated annualized rate or return (which excludes Tesco) is 9.8% (the S&P 500 annualized return for the period is 7.9%) – marketocracy subtracts the equivalent of 2% of assets annually to simulate management fees – as though the portfolio were a mutual fund – so without that the return is about 10.8%). View the current marketocracy Sleep Well portfolio page.
Related: 12 Stocks for 10 Years Update (Feb 2008) – Retirement Account Allocations for Someone Under 40 – Lazy Portfolio Results
Economist challenges government data
An update e-mailed to ShadowStats subscribers at the beginning of the month warned darkly that “GDP (gross domestic product) and Jobs Data Appear Rigged” and “Despite Manipulated Data, the Recession Deepens.”
By his reckoning, the economy shrank 2.5 percent in the year that ended in March, unemployment is really 13 percent and year-over-year inflation is 7.5 percent.
If I was to believe one of those I would pick 7.5% inflation (or at least something a bit closer to that than to and the government figure). If I had to pick one I think is way off, I would pick the unemployment rate. One thing people need to remember is that numbers can be questioned. Often people see a number and just believe it must be true because it is a number (they usually don’t consciously think this but do so sub-consciously). I am losing confidence in the inflation figures quoted by the government (they just seem to far from what seems to be happening). The GDP is never exact, so being off by a couple percent depending on what assumptions you make is not impossible to understand (yet the news media, politicians, business press… act as though the figure is exactly accurate).
John Williams’ web site, Shadow Government Statistics, has the feel of someone that is a gadfly. And I don’t accept his statements, but I believe the government figures are indeed deserving of more scrutiny. It makes perfect sense for inflation to more accurately take into account the substitution effects people can make but that also allows the figures to be more influenced by judgments of what is a fair substitution (and also what is increased quality worth…). And those questions on inflation can directly effect whether the economy (GDP) grew by 1% of shrunk by 2%.
Related: What Do Unemployment Statistics Really Mean? – the Proxy Nature of Data – Washington’s Funny Accounting
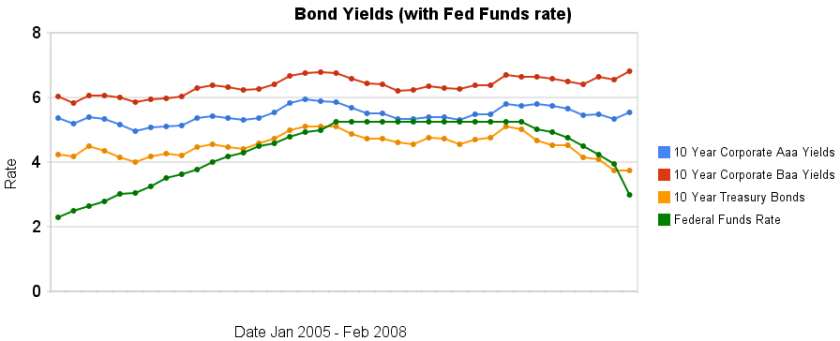
From January 2005 to July 2007 the Federal Funds Rate was steadily increased. The rate was held for a year. Since then the rate has been decreasing (dramatically, recently). As you can see from the chart, 10 year bond yields have been much less variable. The chart also shows 10 year corporate bond yields increasing in February when the federal funds rate fell 100 basis points.
Is the worst over, or just beginning?
…
If rates continue to fall, they could hit not only a new low for the year – the 10-year briefly touched 3.28% in January – but could come close to falling below the 3.07% level they hit in June 2003, which was a 45-year low at the time.
Treasury bond yields are down but a huge part of the reason is a “flight to quality,” where investors are reluctant to hold other bonds (so they buy treasuries when they sell those bonds). Therefore other bond yields (and mortgage rates) are not decreasing (the data in the chart is a bit old – the yields may well decrease some for both 10 year bonds once the March data is posted, though I would expect the spread between treasuries be larger than it was in January).
Data from the federal reserve – corporate Aaa – corporate Baa – ten year treasury – fed funds
Related: 30 Year Fixed Mortgage Rates versus the Fed Funds Rate – After Tax Return on Municipal Bonds