I originally setup the 10 stocks for 10 years portfolio in April of 2005. In order to track performance I setup a marketocracy portfolio but had to make some adjustment to comply with the diversification rules. In December of 2006 I announced a new 11 stocks for the next 10 years (9 are the same, I dropped First Data Corporation, which had split into 2 companies and added Tesco and Yahoo). Now I will add Templeton Emerging Market Fund (EMF) making it 12 stocks for the next 10 years. I like the emerging market area and liked the concentration in China and southeast Asia the Dragon fund offered. I still do, but given the rapid rise in the Chinese market especially other markets look more attractive than previously. EMF will allow for a wider geographic representation.
At this time the stocks in the marketocracy portfolio in order of returns –
Google (134% return, 15% of the marketocracy portfolio, 12% of portfolio if I were buying today)
PetroChina (127%, 7.5%, 8%)
Amazon (92%, 6%, 6%)
Templeton Dragon Fund (73%, 11.5%, 10%)
Toyota (69%, 10%, 10%)
Cisco (54%, 6%, 8%)
Tesco (14% [22.55 purchase price on Dec 11th 2006]*, 0, 10%)
Templeton Emerging Market Fund (EMF) (15%, 2%, 4%)
Intel (6%, 4%, 8%)
Pfizer (-6%, 4%, 8%)
Yahoo (-12%, 4%, 6%)
Dell (-23%, 6%, 10%)
Read more
Jim Jubak makes a good case for why investing is safer overseas now.
…
And as I look ahead, I see few signs that the United States will put its financial ship into better trim and lower the country risk that comes with owning U.S. equities and bonds.
…
I think you need to compare markets one by one to look for those where investors, who tend to stick with the conventional wisdom until something whacks them over the head, have mispriced risk. The countries that I find particularly interesting as investment targets are those that have made the biggest strides in getting their houses in order.
He makes a good point. I have long advocated the benefits of international investing. And looking forward the potential for economic development (and investment gains) outside the USA are strong. As he says this does not mean abandoning the USA stock market but does mean thinking about increasing ownership of foreign stocks (probably using mutual funds though in our 10 stocks for 10 year portfolio we have 3 individual stocks: Toyota, Tesco (added in the December 2006 update), PetroChina and Templeton Dragon Fund [closed end mutual fund]).
Related: State of the nation? Broke – Our Only Hope: Retiring Later
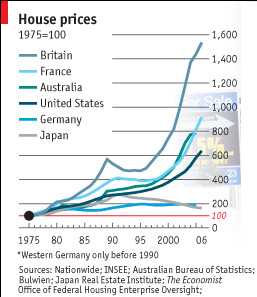
From 1975 to 2006 house prices in the UK increased 14 times. At 14 times that works out to about a 9% annual rate of return which is doesn’t sound nearly as impressive as a 14 fold increase to most people (I believe). The article does not mention if the chart is adjusted for inflation (a 9% return after inflation is incredibly good, a 9% return before factoring in inflation – which would reduce the rate of return – is good but reasonable) – my guess is that the chart is adjusted for inflation (meaning Britain’s owning real estate have been fortunate). Online calculator for annual rates of return over time.
Real estate rate of returns (when calculated on the total price) also underestimate the “real return” most investors experience because investors often only put down a portion of the investment. So the real rate of return is increased dramatically to the investor as a result of the the multiplier effect of buying on margin. Of course, real estate also has expense related to upkeep and the advantage of providing a place to live…
The graph (from the economist – see: Through the roof) shows other countries, USA: about 6 times, France 9 times… Remember these rates are averages for entire countries some areas in each country will have far exceeded these rates.
The graph could be a bit better if they didn’t make several of the colors almost the same.
Related: More Non Bubble Bursting in Housing – Europe and USA Housing Price Boom – How Not to Convert Equity – 30 year fixed Mortgage Rates
Realtors take a large percentage of a home’s sale price for their services. It has never made much sense to me. It does not seem like the services are proportional to the sales price. I don’t see how it costs 5 times more to sell a $1,000,000 house than a $200,000 house. The Freakonomics authors have commented on the problems caused by the way realtors charge for services.
Study Offers Provocative Comparison of Selling a Home:
“Our results are good news for buyers,” he said. “The price buyers pay appears to be driven entirely by the characteristics of the property and of the seller. Whether the property is sold through FSBOMadison.com or a realtor appears to make little difference in terms of purchase price.” “Realtors undoubtedly can provide value to sellers,” Nevo concluded. “But our research shows that for-sale-by-owner Web sites increasingly are making selling your own home more appealing and offering a viable alternative to realtors.”
Study: The Relative Performance of Real Estate Marketing Platforms: MLS versus FSBOMadison.com (pdf)
Very nice illustration in Personal Finance Success Comes More From Smart Budgeting Than Smart Investing:
Now, Kevin’s a smart investing cookie and is able to crank out a 16% return each year. I just take my money, dump it in a Vanguard 500, and move on with life, which means over the long haul I earn a 12% return. Who earns more in the long run?
After five years of this same investing, Kevin has $34,385.68 in his investment account, while I have $63,528.47 in mine, a difference of $29,142.79 in the frugal guy’s favor. Even at the twenty five year mark, if the investments have continued for that long, Kevin has $1,246,070.12 in his account, while I have $1,333,338.70 in mine, a difference of $87,268.58.
I would use lower returns (to better match what I think is reasonable to use in projections about the future) but by using higher returns it actually makes a stronger point (the compounding at 16% is extraordinary – I was actually surprised that at the 25 year mark that the results were the way they were). The lesson is powerful. Your personal finance situation is a factor of several things, but very close to the most important is just actually saving money, as the post illustrates.
Related: Trying to Keep up with the Jones – Earn more, spend more, want more – Living on Less – Saving for Retirement – How much have people saved?
Greenspan Says China Stocks May Post `Dramatic’ Drop:
…
“It is clearly unsustainable,” Greenspan told a conference in Madrid today by satellite. “There is going to be a dramatic contraction at some point.”
Sure seems like a fair point. Over the long term China has great potential but a dramatic decline in stock prices seems a reasonable thing to fear.
Example 30 year mortgage rates (from myfico.com – see site for current rate estimates):
| FICO score | APR | Monthly payment* |
|---|---|---|
| 760-850 | 5.860% | $2,362 |
| 700-759 | 6.082% | $2,419 |
| 660-699 | 6.366% | $2,493 |
| 620-659 | 7.176% | $2,709 |
| 580-619 | 8.820% | $3,167 |
| 500-579 | 9.679% | $3,416 |
Amounts shown for borrowing $400,000 and rates as of May 7th. For scores above 620, the APRs above assume a mortgage with 1.0 points and 80% Loan-to-Value Ratio. For scores below 620, these APRs assume a mortgage with 0 points and 60 to 80% Loan-to-Value Ratio.
FICO scores are determined by your:
- Payment history – 35%
- Amounts owed – 30%
- Length of credit history – 15%
- New credit – 10%
- Types of credit used – 10%
Related: 30 Year Fixed Rate Mortgage Rates – Learning About Mortgages
Live From Omaha: The Berkshire Hathaway Meeting a nice series of posts at fool.com, including:
On a final note, he gave a not-too-surprising suggestion to always look a stock in terms of the whole company. So, for example, if you’re thinking about buying GM (NYSE: GM) at $30, he said, you should consider whether you think the entire company is really worth $18 billion.
I wish someone would post a transcript or at least more details. If you know of a good source, please let me know.
Related: Great investors, Warren Buffett – Buffett’s Newest Letter to Shareholders – Warren Buffett’s Annual Report 2004
Current vs. retirement income: How much do I need?:
After all, rules of thumb are shortcuts; they’re solutions that are supposed to work for the “average” person.
Good advice. The rules of thumb can help you get an idea of the ballpark for a fictional “average” person in general. But your particular situation is different.
Wow. I have been a believer in Amazon’s long term strategy. Earnings have not been as positive as many expected (over the last few years) but I continued to believe Jeff Bezos’ long term strategy and execution were very positive. I was a bit concerned that present earnings were not better. This quarter the earnings were quite impressive. One quarters numbers are not significant to the long term success. And if earnings were to be less impressive in the coming quarters that would not sour me on the stock. But the good earning are a nice surprise and something that has been made possible through many years of smart moves by Amazon (that reduced short term profits over those years).
Net income increased 115% to $111 million in the first quarter, or $0.26 per diluted share, compared with net income of $51 million, or $0.12 per diluted share in first quarter 2006. First quarter 2007 effective tax rate was 23% compared with an effective tax rate of 47% in first quarter 2006.
Related: Amazon Innovation