A few months ago we posted on the effect your FICO (“credit”) score would have on your mortgage payment. Given turmoil in the credit markets we though it would be interesting to revisit that post.
Example 30 year mortgage rates (from myfico.com – see site for current rate estimates):
| FICO score | APR May | APR Aug | payment/mo May | payment/mo Aug |
|---|---|---|---|---|
| 760-850 | 5.86% | 6.27% | $2,362 | $2,467 |
| 700-759 | 6.08% | 6.49% | $2,419 | $2,525 |
| 660-699 | 6.37% | 6.77% | $2,493 | $2,600 |
| 620-659 | 7.18% | 7.58% | $2,709 | $2,819 |
| 580-619 | 8.82% | 9.32% | $3,167 | $3,311 |
| 500-579 | 9.68% | 10.31% | $3,416 | $3,603 |
Amounts shown for borrowing $400,000 and rates as of May 7th. For scores above 620, the APRs above assume a mortgage with 1.0 points and 80% Loan-to-Value Ratio. For scores below 620, these APRs assume a mortgage with 0 points and 60 to 80% Loan-to-Value Ratio.
Frankly I was expecting the rates to show the widely reported expanding of the risk premium (charging increasingly higher rates for riskier borrowers). For example, in May the difference was 382 basis points (9.68% for the lowest FICO range and 5.86% for the highest. However the current difference is just 404 basis points – hardly a big increase. The reason must be that the MyFICO page shows rates for homes with 20% down at the high end of scores and 20-40% down below there.
Related: 30 Year Fixed Rate Mortgage Rates – Learning About Mortgages
Home prices drop for fourth straight quarter. Wow – that sounds bad.
Wow, that doesn’t sound bad. For comparison the NASDAQ index was down 1.6% today. In addition, always remember median prices are not as straight forward as it might seem. The mix of housing that sells changes between the periods being compared. Often (though maybe not this time) as the housing speculation subsides the mix of houses shifts as fewer expensive houses are bought which would tend to mean even if prices for identical houses stayed the same the median price (of houses actually sold) would decline.
There are real changes taking place in the real estate market but the big changes are increased inventories, increased mortgage defaults and a credit crunch – not declining prices. My prediction of price drops was as small as any almost any I saw over the last few years. And so far, the declines are even less than I thought we would see. The biggest factor for the depth of the pricing declines is going to be how many houses are forced into foreclosure (which is unfortunately possibly going to be high due to adjustable rate mortgages being adjusted up and requiring higher mortgage payments).
In the short term, the credit crunch is having an impact and that may increase if the jumbo loans (for those with significant down payment and good credit) continue to be hard to finance. But I don’t expect that to be the situation even 3 months from now – of course I could be wrong. The real estate situation (pricing, inventory…), as often is the case, is hugely impacted by the location. Some areas, like Arizona and Florida, are being hardest hit now.
Related: Real estate articles – Beginning of the End of Housing Bubble? (2004) – Homebuilders’ confidence at 16-year low – mortgage information
Housing inventory glut gets fatter
…
The wait for tenants may be a long one. It’s much harder to get a loan these days for all but the best borrowers. Borrowers, for the most part, now must put more money down, document their income and assets, have few dings against their credit worthiness and show that they can afford the payments. Those tightened lending restrictions eliminate potential buyers from the market, reducing demand even as more supply hits the listings due to big jumps in foreclosures and builders finishing up projects initiated before the slump took hold.
What does the current data show about the real estate market overall? Across the country in the last year the median price has actually increased slightly. It looks like the data for the calendar year 2007 will show a decline for about 2%. Some areas have been much harder hit with median prices dropping over 10% (Las Vegas, Florida, Phoenix…). Mortgages any of 1) questionable credit score 2) jumbo loan or to a lessor extent with little money down are becoming hard to come by. Foreclosures are increasing dramatically. Builders are having a great deal of difficulty selling new housing they have built.
Still the decline in median prices is far from as dramatic as many feel (there have been large changes in the market but it still has not lead to a crash in home values or even a noticeable decline in most places). The increasing supply of houses for sale will put pressure on housing prices to decline. But without a significant continued increase in foreclosures (which is possible but it is still difficult to predict how large an increase we will see) I still do not believe we will see dramatic price declines in most of the country. The possibility (of say declines of over 15% in a year or two) is much higher now than it was in the last couple of years.
Post from 2004 on the real estate bubble worries then – again prices would have to fall a great deal to fall below the prices in 2004 (possible but not very likely to happen in the coming years). The real estate problems are significant and pose a danger to the economy (they certainly are already decreasing economic growth) however that is much different than a crash in housing prices. And as bad as the credit markets have been and rising foreclosures, increased housing inventory the anticipated crash in prices has still not been seen nationwide – and I stand by my belief we won’t see it. Though I will admit less confidently than at any time so far – I would hedge my bet on this prediction at this point (if I actually had bet any money on that prediction – I have no desire to sell any of my 401k money invested in real estate, my rental property or my house).
Well the credit crisis triggered by the fallout from lax mortgage lending is really making waves. It seems we are likely to have some real issues to deal with. The reduction of easy money can have serious consequences to an economy especially one so based on spending beyond what it is producing. I’m still not sure what the overall impact will be but the risks certainly seem to be worth watching.
The world savings glut has overwhelmed the excessive borrowing done by the federal government and private sector and kept interest rates lower than seemed reasonable. That may finally change – or may not, isn’t economics great :-/
Walking to accomplish tasks (getting food, going to work, shopping, going to play basketball) provides a better quality of life than having to drive (getting stuck in traffic jams…) and saves money and protects the environment. Walk Score is a cool web site that lets you calculate a walkability score. I would imagine the better the walkability score the better for the prospects of a real estate investment. You still have to determine if the current price already reflects the long term benefits to quality of life (which are then represented in increased prices) – I think often they will not be providing an investing opportunity. My guess is that real estate would increase above the market if you invested in areas that show walkability score increases during your ownership.
Related: Urban Planning and Real Estate Investing – Real Estate articles – 30 year fixed Mortgage Rates – Real estate blog posts
Sorry but that is a symptom of massive ignorance. Not knowing an incredible important aspect of your largest financial decision is like not know what days you are suppose to show up for work. There is a minimum amount of knowledge people should have that sign a mortgage. I think at least 34% of mortgage holders need to read this blog. Ok, I probably alienated all of them, so if that is the case then they should read some of the blogs we list in our blogroll.
There is a big problem in that logic – it could maybe make sense if you had good reason to believe rates will be lower in the future than when you took out the loan (but that is a very questionable). I don’t know why someone would think that in the last couple of years – the risks have been much better than rates would go up a few hundred basis points than down that much. Basically I can see someone that is very financially savvy using an adjustable mortgage to qualify and if they know they will move in a fairly short period…
Related: Learning About Mortgages – Mortgage Defaults: Latest Woe for Housing – How Not to Convert Equity – 30 year fixed Mortgage Rates
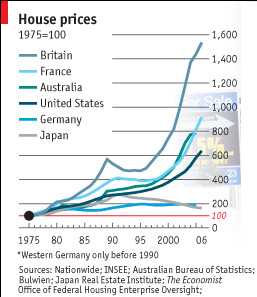
From 1975 to 2006 house prices in the UK increased 14 times. At 14 times that works out to about a 9% annual rate of return which is doesn’t sound nearly as impressive as a 14 fold increase to most people (I believe). The article does not mention if the chart is adjusted for inflation (a 9% return after inflation is incredibly good, a 9% return before factoring in inflation – which would reduce the rate of return – is good but reasonable) – my guess is that the chart is adjusted for inflation (meaning Britain’s owning real estate have been fortunate). Online calculator for annual rates of return over time.
Real estate rate of returns (when calculated on the total price) also underestimate the “real return” most investors experience because investors often only put down a portion of the investment. So the real rate of return is increased dramatically to the investor as a result of the the multiplier effect of buying on margin. Of course, real estate also has expense related to upkeep and the advantage of providing a place to live…
The graph (from the economist – see: Through the roof) shows other countries, USA: about 6 times, France 9 times… Remember these rates are averages for entire countries some areas in each country will have far exceeded these rates.
The graph could be a bit better if they didn’t make several of the colors almost the same.
Related: More Non Bubble Bursting in Housing – Europe and USA Housing Price Boom – How Not to Convert Equity – 30 year fixed Mortgage Rates
Realtors take a large percentage of a home’s sale price for their services. It has never made much sense to me. It does not seem like the services are proportional to the sales price. I don’t see how it costs 5 times more to sell a $1,000,000 house than a $200,000 house. The Freakonomics authors have commented on the problems caused by the way realtors charge for services.
Study Offers Provocative Comparison of Selling a Home:
“Our results are good news for buyers,” he said. “The price buyers pay appears to be driven entirely by the characteristics of the property and of the seller. Whether the property is sold through FSBOMadison.com or a realtor appears to make little difference in terms of purchase price.” “Realtors undoubtedly can provide value to sellers,” Nevo concluded. “But our research shows that for-sale-by-owner Web sites increasingly are making selling your own home more appealing and offering a viable alternative to realtors.”
Study: The Relative Performance of Real Estate Marketing Platforms: MLS versus FSBOMadison.com (pdf)
Example 30 year mortgage rates (from myfico.com – see site for current rate estimates):
| FICO score | APR | Monthly payment* |
|---|---|---|
| 760-850 | 5.860% | $2,362 |
| 700-759 | 6.082% | $2,419 |
| 660-699 | 6.366% | $2,493 |
| 620-659 | 7.176% | $2,709 |
| 580-619 | 8.820% | $3,167 |
| 500-579 | 9.679% | $3,416 |
Amounts shown for borrowing $400,000 and rates as of May 7th. For scores above 620, the APRs above assume a mortgage with 1.0 points and 80% Loan-to-Value Ratio. For scores below 620, these APRs assume a mortgage with 0 points and 60 to 80% Loan-to-Value Ratio.
FICO scores are determined by your:
- Payment history – 35%
- Amounts owed – 30%
- Length of credit history – 15%
- New credit – 10%
- Types of credit used – 10%
Related: 30 Year Fixed Rate Mortgage Rates – Learning About Mortgages
Victim of Real Estate Bust: Your Pension – Part 2:
The central premise of this post is that risk is being mispriced by the market (by failing to account for the risks bonds… are overpriced). And that when those risks are exposed (for example, as the sub prime crisis builds, recession…) prices will fall. Historically markets do exhibit this pattern – when times are good risks are not fully factored into prices, then those risks are appreciated and prices decline.
Related: adjustable rate mortgage – investment risks – Mortgage Defaults: Latest Woe for Housing – Coming Collapse in Housing? – How Not to Convert Equity – Saving for Retirement
This interesting graph, shows the amount of adjustable rate mortgages due for interest rate adjustments (which will increase mortgage payments for millions of people).
Read more