Since August of 2008 conforming mortgage rates are have declined a huge amount. Jumbo rates have fallen a large amount also, but much less (for example for a credit score of 700-759 the jumbo rates declined 73 basis points while the conventional rate declined 172 basis points.
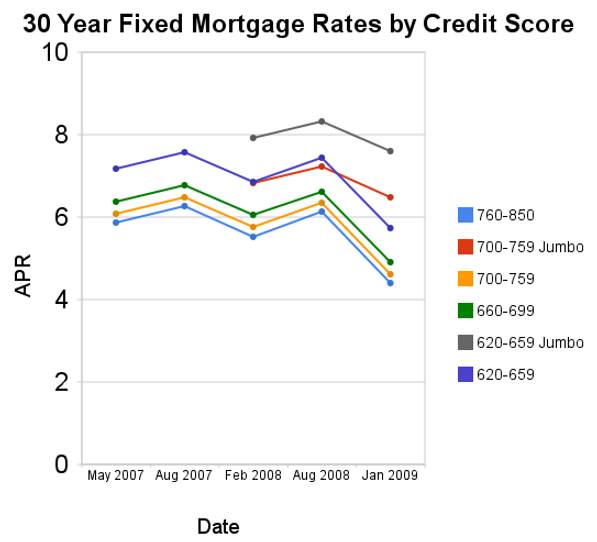
For scores above 620, the APRs above assume a mortgage with 1 point and 80% Loan-to-Value Ratio. For scores below 620, these APRs assume a mortgage with 0 points and 60 to 80% Loan-to-Value Ratio. You can see, with these conditions the rate difference between a credit score of 660 and 800 is not large (remember this is with 20% down-payment) and has not changed much (the difference between the rates if fairly consistent).
Related: Low Mortgage Rates Not Available to Everyone – 30 Year Fixed Rate Mortgage Rate Data – Real Free Credit Report (in USA) – Jumbo Mortgage Shoppers Get Little Relief From Rates – posts on mortgages
Read more
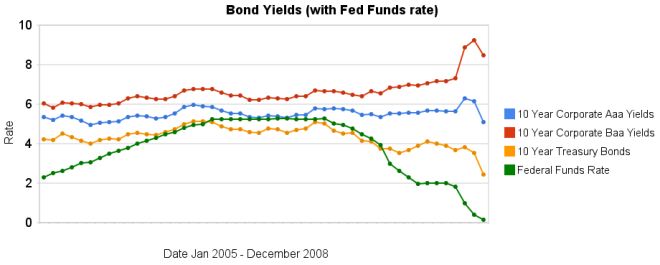
The recent reactions to the credit and financial crisis have been dramatic. The federal funds rate has been reduced to almost 0. The increase in the spread between government bonds and corporate bonds has been dramatic also. In the last 3 months the yields on Baa corporate bonds have increased significantly while treasury bond yields have decreased significantly. Aaa bond yields have decreased but not dramatically (57 basis points), well at least not compared to the other swings.
The spread between 10 year Aaa corporate bond yields and 10 year government bonds increased to 266 basis points. In January, 2008 the spread was 159 points. The larger the spread the more people demand in interest, to compensate for the increased risk. The spread between government bonds and Baa corporate bonds increased to 604 basis points, the spread was 280 basis point in January, and 362 basis points in September.
When looking for why mortgage rates have fallen so far recently look at the 10 year treasury bond rate (which has fallen 127 basis points in the last 3 months). The rate is far more closely correlated to mortgage rates than the federal funds rate is.
Data from the federal reserve – corporate Aaa – corporate Baa – ten year treasury – fed funds
Related: Corporate and Government Bond Rates Graph (Oct 2008) – Corporate and Government Bond Yields 2005-2008 (April 2008) – 30 Year Fixed Mortgage Rates versus the Fed Funds Rate – posts on interest rates – investing and economic charts
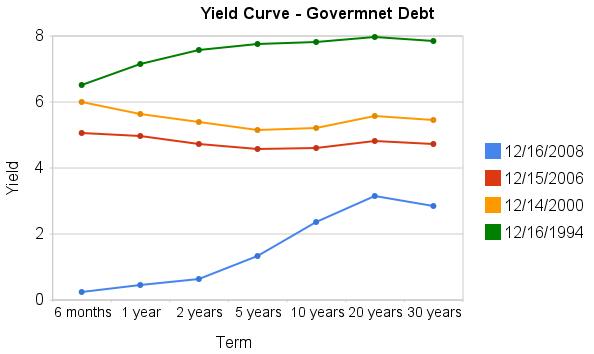
Treasury bills have been providing remarkably low yields recently. And the Fed today cut their target federal funds rate to 0-.25% (what is the fed funds rate?). With such low rates already in the market the impact of a lowered fed funds rate is really negligible. The importance is not in the rate but in the continuing message from the Fed that they will take extraordinary measures to soften the recession.
There are significant risks to this aggressive strategy (and there would be risks for acting cautiously too). But I cannot understand investing in the dollar under these conditions or in investing in long term bonds (though lower grade bonds might make some sense as a risky investment for a small portion of a portfolio as the prices have declined so much).
The current yields, truly are amazing as this graph shows. The chart shows the yield curve in Dec 2008, 2006, 2000 and 1994 based on data from the US Treasury
Related: Corporate and Government Bond Rates Graph – Discounted Corporate Bonds Failing to Find Buying Support – Municipal Bonds After Tax Return – Total Return
The percentage of loans in the foreclosure process at the end of the third quarter was 2.97 percent, an increase of 22 basis points from the second quarter of 2008 and 128 basis points from one year ago. The percentage of loans in the process of foreclosure set a new record this quarter, to 1.35 million.
Mortgages are counted as delinquent or in foreclosure (once they are in foreclosure they are not counted as delinquent). So the total percentage of mortgages not being paid by the homeowner is 2.97% (in foreclosure) + 6.99% (delinquent) = 9.96%. That is amazingly bad. In February of 2007 I wrote about this and the delinquency rate was 4.7% which sounded pretty bad to me. Amazingly 4.4% is a historic low for this figure. Can you believe 1/25 mortgages is delinquent and that is as good as we ever get? That is pretty shocking to me.
The seasonally adjusted total delinquency rate is now the highest recorded in the Mortgage Bankers Association survey. The seasonally adjusted delinquency rate increased 41 basis points to 4.34 percent for prime loans, increased 136 basis points to 20.03 percent for subprime loans, increased 29 basis points to 12.92 percent for FHA loans, and increased 46 basis points to 7.28 percent for VA loans.
The percent of loans in the foreclosure process increased 16 basis points to 1.58 percent for prime loans, and increased 74 basis points for subprime loans to 12.55 percent. FHA loans saw an eight basis point increase in the foreclosure inventory rate to 2.32 percent, while the foreclosure inventory rate for VA loans increased 13 basis points to 1.46 percent.
Since loans that would have gone into foreclosure in the past are being kept out of foreclosure due to some programs ( ) the rate or seriously delinquent is a useful measure of serious problems. Seriously delinquent mortgages are 90 days past due. The rate increased 52 basis points for prime loans to 2.87 percent, increased 171 basis points for subprime loans to 19.56 percent, increased 62 basis points for FHA loans to 6.05 percent, and increased 45 basis points for VA loans percent to 3.45 percent.
Compared to a year ago: the seriously delinquent rate was 156 basis points higher for prime loans and 818 basis points higher for subprime loans. The rate also increased 51 basis points for FHA loans and 89 basis points for VA loans.
Related: Homes Entering Foreclosure at Record (Sep 2007) – Foreclosure Filings Continue to Rise – How Much Worse Can the Mortgage Crisis Get? – How Not to Convert Equity
Jobless Rate Rises to 6.7% in November
…
The decline, the largest one-month loss since December 1974, was fresh evidence that the economic contraction accelerated in November, promising to make the current recession, already 12 months old, the longest since the Great Depression. The previous record was 16 months, in the severe recessions of the mid-1970s and early 1980s.
…
The manufacturing sector has been particularly hard hit, losing more than half a million jobs this year. That is nearly half the 1.2 million jobs lost since employment peaked in December and, in January, began its uninterrupted decline. The cutbacks seem likely to accelerate as the three Detroit automakers close more factories and shrink payrolls even more
…
With all this in mind, and particularly the shrinking employment rolls, economists are estimating that the gross domestic product is contracting at an annual rate of 4 percent or more in the fourth quarter, after a decline of 0.3 percent in the third quarter.
The news was even worse than the anticipated 350,000 losses. And Previous months figures were adjusted from 240,000 losses in October to 320,00 and from 284,000 in September to 403,000. And these numbers are on an already extremely poor job picture the previous 7 years. One of the great strengths of the US economy over the last 50 years has been job creation. We know we are in for serious problems, the question is how serious and how long. One of the most important gages of that will be how many jobs are lost.
When job losses stop and job gains start (in the aggregate, for the entire economy) it will be a very positive sign. Normally jobs are a lagging indicator, meaning job data lags the actual economy. Job losses will not increases until after the economy starts to grow. Of course, economic data doesn’t always fit the conventional wisdom.
This is one more piece of evidence that the economy is not looking good. And 2009 is likely to be a bad year for the economy overall.
Related: Bad News on Jobs (Sep 2008) – What Do Unemployment Stats Mean? – The Economy is in Serious Trouble – Financial Market Meltdown
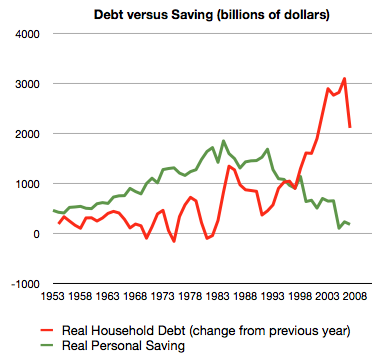
The whole sorry mess in one picture (including chart) by Philip Brewer
…
Starting back in about 2005, the American consumer reached the point that they could no longer service ever-increasing amounts of debt. That led to the housing bubble popping. The result is what you can see in the last datapoint on the graph–less new borrowing in 2007.
Related: $2,540,000,000,000 in USA Consumer Debt – Americans are Drowning in Debt – save an emergency fund – Financial Illiteracy Credit Trap – posts on saving money
S&P 500 Payout Tops Bond Yield, a First Since 1958 (site broke the link, so I removed it):
…
Treasuries routinely had higher yields than stocks before 1958, according to Bernstein. When this relationship came to an end, yields were near their current levels. The S&P 500 dividend yield fell 0.58 percentage point, to 3.24 percent, in the third quarter of 1958. The 10-year yield rose about the same amount, 0.6 point, to 3.80 percent.
Two explanations later emerged for the reversal, he wrote. One held that the economy’s recovery from the 1957-58 recession showed “investors could finally put to rest the widely held expectation of an imminent return to the Great Depression.” The second was the increasing popularity of investing in growth stocks, or shares of companies whose sales and earnings rose at a relatively fast pace. Because of their expansion, the companies often paid below-average dividends.
Reversal of Fortunes Between Stocks and Bonds
Arnott takes it a step further. “In a world of deleveraging, both for the financial services arena and for the economy at large, growth is less certain,” he says. “And with the economy eroding sharply, so is inflation. If stocks don’t deliver nominal growth in dividends and earnings, then their yield ‘must’ exceed the Treasury yield, in order to give us any sort of risk premium.”
Related: Corporate and Government Bond Rates Graph – Highest Possible Returns – posts on interest rates – investing strategy
More dramatic evidence that changing in the federal funds rate do not lead to similar changes in 30 year fixed mortgage rates. It is true the last few months are very unusual times for the credit market. However, the current lack of correlation is not the exception, the graph clearly shows there is very little correlation between changes in the two interest rates.
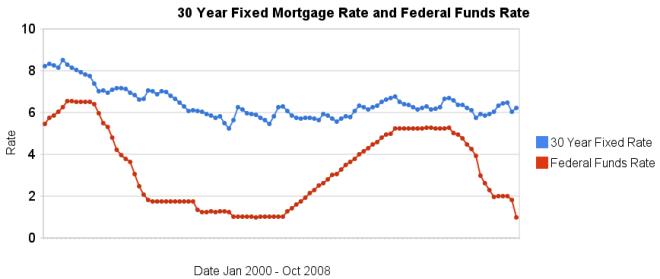
Related: historical comparison of 30 year fixed mortgage rates and the federal funds rate – Affect of Fed Funds Rates Changes on Mortgage Rates – posts on financial literacy – Jumbo v. Regular Fixed Mortgage Rates: by Credit Score
For more data, see graphs of the federal funds rate versus mortgage rates for 1980-1999. Source data: federal funds rates – 30 year mortgage rates
Since the S&P/Case-Shiller 20 city home price index peaked in June 2006 it has fallen 19.5%. In the year ending July 2008 the decline was 16.3%. That is a record drop. In that year Las Vegas declined 29.9%, Phoenix 29.3% and Miami 28.2%. For the largest cities: New York City declined 7.4%, Los Angeles 26.2%, Chicago 10% and Dallas 2.5% (the second lowest decline – Charlotte declined 1.8%); Houston and Philadelphia, the 4th and 5th largest cities are not included in the 20 city index.
Only one city shows a decline in housing values since January, 2000: Detroit is down nearly 7%. Washington is up 95% since January, 2000 (even with a 15.8% decline in the last year), Los Angels and New York are tied for second at 93% increases. The 20 city index is up 66% from January 2000 to July 2008.
The S&P/Case-Shiller Composite of 20 Home Price Index is a value-weighted average of the 20 metro area indices for single family homes.
Source: Record Home Price Declines (pdf)
Related: Housing Prices Post Record Declines – Home Price Declines Exceeding 10% Seen for 20% of Housing Markets – Fourteen Fold Increase in 31 Years – The Ever Expanding House – Coming Collapse in Housing?
I have had difficulty finding good economic data on manufacturing jobs. I have posted about this previously but have trouble finding much worth posting about: Worldwide Manufacturing Job Data – Manufacturing Jobs. The Unites States Department of Labor, Bureau of Labor Statistics has published some interesting data and so here is a look at some of that data.
The table shows average annual productivity gains (output per hour, in USA dollars – I think it is not clear) – the 2007 output totals are from the United Nations data I posted about last week (Data on Top Manufacturing Countries).
| Average Annual Manufacturing Productivity Gains by Country | ||||||
|---|---|---|---|---|---|---|
| Country | 1979-1990 | 1990-1995 | 1995-2000 | 2000-2007 | 1979-2007 | 2007 Output $USA billion |
| Taiwan | 6.1 | 4.7 | 5.6 | 6.4 | 5.9 | |
| Korea | NA | 9.4 | 10.8 | 7.6 | NA | 241 |
| USA | 2.8 | 3.7 | 5.6 | 4.6 | 3.9 | 1,831 |
| France | 3.8 | 3.4 | 4.6 | 3.5 | 3.8 | 296 |
| Japan | 3.8 | 3.3 | 3.4 | 3.8 | 3.6 | 926 |
| United Kingdom | 4.1 | 2.8 | 2.7 | 3.9 | 3.6 | 342 |
| Germany | 2.1 | 2.9 | 3.7 | 3.8 | 3.0 | 670 |
| Spain | 3.3 | 3.1 | 0.8 | 2.1 | 2.5 | 208 |
| Canada | 2.1 | 3.4 | 3.8 | 1.1 | 2.4 | 218 |
| Italy | 3.4 | 3.8 | 1.4 | -.2 | 2.2 | 345 |
The countries that were part of the study but are not included in the table above: Australia, Belgium, Denmark, Netherlands, Norway, Sweden.
Manufacturing productivity increased in 14 of 16 countries in 2007, according to the study. The United States of America increase of 4.1 was the fourth largest among the 16 economies and was slightly above the 3.9 percent U.S. average annual increase since 1979. 15 of the 16 countries increased manufacturing output in 2007.
9 countries increased manufacturing hours worked in 2007, the USA increased 2.3% (below their average increase since 1979). Hours worked decreased for all countries in the period of 2000-2007 (UK has had the largest decrease 3.9% annual average decrease, the USA in next at 3.1%).
Manufacturing employment increased in 10 countries in 2007. From 2000-2007 the USA has experienced average annual declines of 3% in manufacturing employment (the second sharpest drop to the UK which has fallen 4%). From 1979-2007 the USA annual declines averaged 1.2% (only Taiwan.9% and Spain .1% showed increases). From 2000-2007 four countries show slight average annual increases: Spain .5%, Korea .4%, Taiwan .2% and Italy .2%. From 2000-2007 only 3 countries showed annual average decreases in output: Canada -.3%, Italy -.2% and UK – .1%.
Hourly manufacturing compensation has increased in all countries for the period 1979-2007 (data shown for this item is in each national currency: USA 4.6% average annual increases, Spain up 7.2% annually, Taiwan up 7%, UK 6.8%, Germany 4.4%, Japan 4.2%.
via: Canada’s Manufacturing Crisis in International Perspective
Related: posts on employment – Top 10 Manufacturing Countries 2006