The updated data from the United Nations on manufacturing output by country clearly shows the USA remains by far the largest manufacturer in the world. UN Data, in billions of current US dollars:
| Country | 1990 | 1995 | 2000 | 2005 | 2006 | 2007 |
|---|---|---|---|---|---|---|
| USA | 1,041 | 1,289 | 1,543 | 1,663 | 1,700 | 1,831 |
| China | 143 | 299 | 484 | 734 | 891 | 1,106 |
| Japan | 804 | 1,209 | 1.034 | 954 | 934 | 926 |
| Germany | 438 | 517 | 392 | 566 | 595 | 670 |
| Russian Federation | 211 | 104 | 73 | 222 | 281 | 362 |
| Italy | 240 | 226 | 206 | 289 | 299 | 345 |
| United Kingdom | 207 | 219 | 228 | 269 | 303 | 342 |
| France | 224 | 259 | 190 | 249 | 248 | 296 |
| Korea | 65 | 129 | 134 | 200 | 220 | 241 |
| Canada | 92 | 100 | 129 | 177 | 195 | 218 |
| Spain | 101 | 103 | 98 | 164 | 176 | 208 |
| Brazil | 120 | 125 | 96 | 137 | 170 | 206 |
| Additional countries of interest – not the next largest | ||||||
| India | 50 | 59 | 67 | 118 | 135 | 167 |
| Mexico | 50 | 55 | 107 | 122 | 136 | 144 |
| Indonesia | 29 | 60 | 46 | 80 | 102 | 121 |
| Turkey | 33 | 38 | 38 | 75 | 85 | 101 |
The USA’s share of the manufacturing output of the countries that manufactured over $200 billion in 2007 (the 12 countries on the top of the chart above) in 1990 was 28%, 1995 28%, 2000 33%, 2005 30%, 2006 28%, 2007 27%. China’s share has grown from 4% in 1990, 1995 7%, 2000 11%, 2005 13%, 2006 15%, 2007 16%.
Total manufacturing output in the USA was up 76% in 2007 from the 1990 level. Japan, the second largest manufacturer in 1990, and third today, has increased output 15% (the lowest of the top 12, France is next lowest at 32%) while China is up an amazing 673% (Korea is next at an increase of 271%).
Read more
On Wednesday of last week the United States 3 month treasury bill yield reached .03%, yet another remarkable chart from the current crisis.
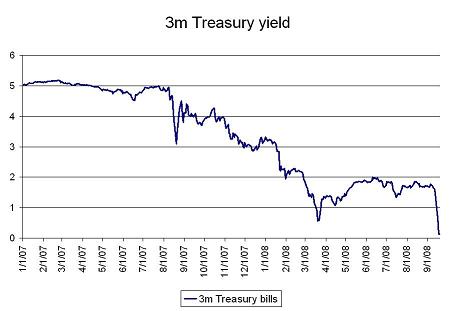
via: No one wants to hold risk … – “I guess this is what a close to systemic financial crisis in the US looks like”
Daily Treasury Yield Rates show that the rate for Friday the 12th of September 1.49%, Monday the 15th 1.02%, Tuesday .84%, Wednesday .03%, Thursday .23% and Friday .99%.
Related: Corporate and Government Bond Yields – Curious Cat Investing and Economics Search – Credit Crisis Continues (April 2008)
The growth in the number of jobs in the USA continues to be bad. The growth in jobs has been very poor thus far this century. The good news has been unemployment has been fairly low, it now sits at a 4 year high of 5.7% (which is not great but not horrible by historic standards).
Update: today the labor department announced the unemployment rate increased to 6.1%.
This year the news has been worse, with actually declining numbers of jobs and some economics see No job turnaround on horizon:
…
“I’m not expecting increases in employment until next year because in the second half of this year we’ll see very lethargic economic growth,” said Joel Prakken, chairman of Macroeconomic Advisers. The Conference Board has created a new reading called the Employment Trends Index, which combines a number of different economic readings to predict when employment will turn higher or lower. The index, which typically signals three to six months before job losses will turn to job gains, has yet to show signs of a recovery.
“We think the unemployment rate will keep growing, probably reach between 6 to 6.5% by mid 2009 and only start declining in the second half of next year,” said Gad Levanon, senior economist at The Conference Board.
Related: What Do Unemployment Stats Mean? – Economic Fault: Income Inequality
The Declining Value Of Your College Degree by Greg Ip:
For decades, the typical college graduate’s wage rose well above inflation. But no longer. In the economic expansion that began in 2001 and now appears to be ending, the inflation-adjusted wages of the majority of U.S. workers didn’t grow, even among those who went to college. The government’s statistical snapshots show the typical weekly salary of a worker with a bachelor’s degree, adjusted for inflation, didn’t rise last year from 2006 and was 1.7% below the 2001 level.
…
To be sure, the average American with a college diploma still earns about 75% more than a worker with a high-school diploma and is less likely to be unemployed. Yet while that so-called college premium is up from 40% in 1979, it is little changed from 2001
The job market is more challenging than it was, it seems to me. Counting on being able to steadily progress during your career, without any gaps or times when you must accept much less than you hoped, is risky. This is one more reason why it is so important to spend less and save more in the good times in your career.
Related: What Do Unemployment Stats Mean? – Engineering Graduates Again in Great Shape – USA Job Growth – The IT Job Market
U.S. Consumer Prices Jumped in June by the Most in 26 Years
…
Prices increased 5 percent in the 12 months to June, the most since May 1991. They were forecast to climb 4.5 percent from a year earlier, according to the survey median. The core rate increased 2.4 percent from June 2007, also more than forecast.
Energy expenses jumped 6.6 percent, the biggest gain since the aftermath of Hurricane Katrina in September 2005. Gasoline prices soared 10.1 and fuel oil jumped 10.4 percent.
…
Rents which, make up almost 40 percent of the core CPI, also accelerated. A category designed to track rental prices rose 0.3 percent after a 0.1 percent gain in May. Today’s figures also showed wages decreased 0.9 percent in June after adjusting for inflation, the biggest drop since August 1984, and were down 2.4 percent over the last 12 months. The drop in buying power is one reason economists forecast consumer spending will slow.
The continued increase of inflation is a serious problem. Eventually the federal reserve needs to take serious action (raising the discount rate). And the politicians need to stop raising taxes on the future to spend more and more every year. Their continued financial irresponsibility is a large part of the reason for the declining value of the dollar – along with the voters that keep electing those proposing large increases in spending while pushing off paying for that spending to future tax increases.
Related: inflation investment risk – Food Price Inflation is Quite High – Bernanke warns of inflation – Politicians Again Raising Taxes On Your Children – USA Federal Debt Now $516,348 Per Household
Read more
The largest oil consuming countries (and EU), in millions of barrels per day:
| Country | consumption | % of oil used | % of population | % of World GDP |
|---|---|---|---|---|
| USA | 20.8 | 25.9 | 4.5 | 21.0 |
| European Union | 14.6 | 18.1 | 7.4 | 21.9 |
| China | 6.9 | 8.6 | 19.9 | 10.7 |
| Japan | 5.4 | 6.7 | 1.9 | 6.5 |
| Russia | 2.9 | 3.6 | 2.1 | 3.2 |
| Germany | 2.6 | 3.3 | 1.2 | 4.3 |
| India | 2.4 | 3.0 | 17.0 | 4.6 |
| Canada | 2.3 | 2.9 | 0.5 | 1.9 |
| Korea | 2.1 | 2.7 | 0.7 | 1.8 |
| Brazil | 2.1 | 2.6 | 2.9 | 2.8 |
| Mexico | 2.1 | 2.6 | 1.6 | 2.1 |
All data is from CIA World Factbook 2008 (downloaded Jun 2008). GDP calculated using purchasing power parity.
Related: Top 10 Manufacturing Countries 2006 – Country H-index Rank for Science Publications – Best Research University Rankings (2007)
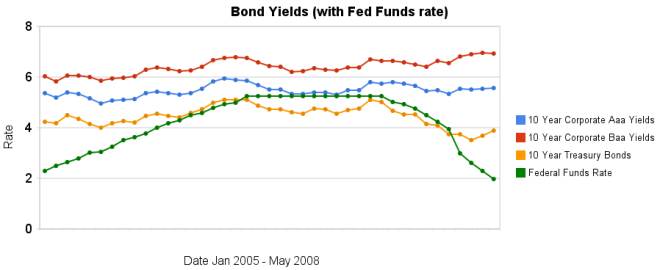
Over the last 2 months the yields on bonds have increased the discount rate has continued to decline.
The spread between corporate bond yields and government bonds has decreased a bit as treasury yields have increased 37 basis points compared to just 4 and 6 basis point increased in corporate bond yields.
Data from the federal reserve – corporate Aaa – corporate Baa – ten year treasury – fed funds
Related: Bond Yields 2005-2008 – 30 Year Fixed Mortgage Rates versus the Fed Funds Rate – Initial Retirement Account Allocations
Economic statistics, like all data, needs to be defined. The way to collect data (economic data or any other type) is to operationally define the terms. Statistics don’t lie. Statistics can be faulty, when those collecting the data fail to use good operational definitions and the data quality is poor (without a definition people make guess…). People can also just make up false number. And people can try to mislead by stating statistics in a way that seem to indicate something that is not the most accurate way to view the whole situation.
The way to cope with such problems is to understand statistics and data. The data can be wrong. So you have to access that possibility. And the data can mean something different than you assume (and often the data is not presented with the operation definitions). When that is the case be careful about your assumptions (with financial and economic data and other data too). But don’t decide to just ignore data because then you condemn yourself to ignorance of the many things which data shed light onto.
In, What ‘Unemployment’ Really Means These Days, the unemployment data is explored. The post does a good job of showing how you can get different measures of the “unemployment rate” depending on how you define what you will measure. I happen to believe the existing measure is best but you need to understand that it doesn’t factor in underemployment and people giving up completely… I believe the best way to deal with those weaknesses is to have supplementary measures that enhance your understanding of the unemployment rate. And too view it as only one measure of economic health. Look also at median wages, health care coverage, hours worked, vacation time…
Read more