Fed Focusing on Real-Estate Recession as Bernanke Convenes FOMC
…
Commercial property is “certainly going to be a significant drag” on growth, said Dean Maki, a former Fed researcher who is now chief U.S. economist in New York at Barclays Capital Inc., the investment-banking division of London-based Barclays Plc. “The bigger risk from it would be if it causes unexpected losses to financial firms that lead to another financial crisis.”
…
Any sales of mortgage-backed bonds would be the first new issues in the $700 billion U.S. market for commercial-mortgage- backed securities since it was shut down by the credit freeze in 2008. About $3 billion are in the pipeline, and the success of these sales may foster as much as $25 billion in total deals in the next six months
…
Forty-seven percent of loans at the 7,000-plus smaller U.S. lenders are in commercial real estate, compared with 17 percent for the biggest banks…
Related: Data Shows Subprime Mortgages Were Failing Years Before the Crisis Hit – Home Values and Rental Rates – Record Home Price Declines (Sep 2008)
The USA unemployment rate dropped slightly to 9.4%. The economy lost 247,000 jobs which is both a sign the economy is not strong and also that it is improving (job losses from November through April were 645,000/month and 331,000/month from May through July). The job losses for May and June were both revised to show 20,000 fewer job losses each in the press release from the Bureau of Labor Statistics.
The number of long-term unemployed (those jobless for 27 weeks or more) rose by 584,000 over the month to 5.0 million. In July, 1 in 3 unemployed persons were jobless for 27 weeks or more.
The employment-population ratio, at 59.4%, was little changed over the month but has declined by 330 basis points since the recession began in December 2007. About 2.3 million persons were marginally attached to the labor force in July, 709,000 more than a year earlier (The data are not seasonally adjusted). These individuals, who were not in the labor force, wanted and were available for work and had looked for a job sometime in the prior 12 months. They were not counted as unemployed because they had not searched for work in the 4 weeks preceding the survey.
In July, the average workweek of production and nonsupervisory workers on private nonfarm payrolls edged up by 0.1 hour to 33.1 hours. The manufacturing workweek increased by 0.3 hour to 39.8 hours. Factory overtime was unchanged at 2.9 hours.
This news supports the increasing livelihood of a weak recovery taking hold during 2009 – which is frankly pretty amazing in my opinion. The economy could certainly have taken longer to recover. Still, more job losses and an increasing unemployment rate are likely before the end of 2009.
Related: Another 450,000 Jobs Lost in June – USA Unemployment Rate Jumps to 9.4% (May 2009) – USA Unemployment Rate Rises to 8.1%, Highest Level Since 1983 (March 2009)
Read more
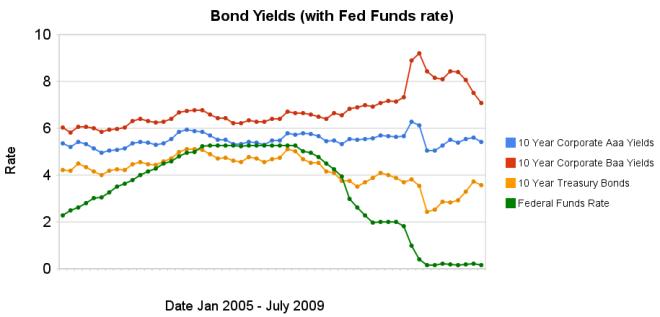 Chart showing corporate and government bond yields by Curious Cat Investing Economics Blog, Creative Commons Attribution, data from the Federal Reserve.
The changes in bond yields over the last 3 months months indicate a huge increase in investor confidence. The yield spread between corporate Baa 10 year bonds and 10 year treasury bonds increased 304 basis points from July 2008 to December 2008, indicating a huge swing in investor sentiment away from risk and to security (US government securities). From April 2009 to July 2009 the yield spread decreased by 213 basis points showing investors have moved away from government bonds and into Baa corporate bonds.
From April to July 10 year corporate Aaa yields have stayed essentially unchanged (5.39% to 5.41% in July). Baa yields plunged from 8.39% to 7.09%. And 10 year government bond yields increased from 2.93% to 3.56%. federal funds rate remains under .25%.
Investors are now willing to take risk on corporate defaults for a much lower premium (over government bond yields) than just a few months ago. This is a sign the credit crisis has eased quite dramatically, even though it is not yet over.
Data from the federal reserve: corporate Aaa – corporate Baa – ten year treasury – fed funds
Related: Continued Large Spreads Between Corporate and Government Bond Yields (April 2009) – Chart Shows Wild Swings in Bond Yields (Jan 2009) – investing and economic charts
Here is an excellent article on how to invest in the stock market. I personally tweak this advice a bit but it is much better than most advice you get. Basically keep costs down (don’t pay large fees) and diversify. Lazy Portfolios seven-year winning streak by Paul Farrell
…
In short, even though we know that the average compensation of portfolio managers is often $400,000 to more than a $1 million, the hot-shot managers of these actively managed funds provided no value-added to their funds’ performance. Conclusion: Their investors would be better off investing in index funds.
…
Yes, the market was in negative territory the past few years, but still all eight Lazy Portfolios outperformed each of the six actively-managed funds.
…
Customize your own Lazy Portfolio following these six rules and you’ll win. More important, you’ll have lots of time left to enjoy what really counts, your family, friends, career, sports, hobbies, living.
…
2) Frugality, savings versus financial obesity. Tools like starting early, autopilot saving plans, dollar-cost averaging, frugal living and other tricks are familiar to long-term investors. Trust your frugality instincts — living below your means — it’s a trait common among America’s “millionaires next door.”
Related: Lazy Portfolio Results (April 2008) – Allocations Make A Big Difference – 12 stocks for 10 years – 401(k)s are a Great Way to Save for Retirement
Apartment Vacancy at 22-Year High in U.S.
…
Asking rents for apartments fell 0.6 percent in the second quarter from the first, Reis said. That matched the rate of change in the first quarter, the biggest drop since Reis began reporting such data in 1999.
…
New York had the lowest vacancy rate in the second quarter, at 2.9 percent, followed by New Haven, home to Yale University; Central New Jersey; New York’s Long Island; and Syracuse, New York, according to Reis.
Related: Housing Rents Falling in the USA – Rent Controls are Unwise – It’s Now a Renter’s Market – articles on investing and real estate
The decisions over the past 30 years to pass huge huge tax bills to those in the future is unsustainable. Saying you cut taxes when all you actually do is postpone them is dishonest. However, many people go along with such false statements so politicians have learned to buy votes today by raising taxes on the future. Since the public keeps voting for such people when the facts are clear the only explanation is they support raising taxes, not today, but in the future (or, I suppose, they are not able to understand the clear implications of what they vote for). The Long-Term Budget Outlook
…
For decades, spending on Medicare and Medicaid has been growing faster than the economy. CBO projects that if current laws do not change, federal spending on Medicare and Medicaid combined will grow from roughly 5 percent of GDP today to almost 10 percent by 2035. By 2080, the government would be spending almost as much, as a share of the economy, on just its two major health care programs as it has spent on all of its programs and services in recent years.
…
CBO projects that Social Security spending will increase from less than 5 percent of GDP today to about 6 percent in 2035 and then roughly stabilize at that level.
…
Federal interest payments already amount to more than 1 percent of GDP; unless current law changes, that share would rise to 2.5 percent by 2020.
The cost of paying for a dysfunctional medical system has been a huge drain on the USA economy for decades. But that is nothing compared to what the future holds if we don’t adopted sensible strategies that reduce the huge extra costs we pay and the worse performance we receive for that cost.
Social security is not the huge problem many think it is. Still I would support reducing the payout to wealthy individuals and bringing the age limits more in line with the changes in life expectancy. 12.4% of pay for low and middle wage workers (high income earners stop paying social security taxes so in effect marginal tax rates decrease by 12% for any income above $106,800). Medicare taxes add 2.9% bringing the total social security and Medicare taxes to 15.1% (including both the amount paid directly by the employee and the amount paid for the employee by the employer).
Related: True Level of USA Federal Deficit – USA Federal Debt Now $516,348 Per Household – quotations about economics – articles on improving the health care system – USA Spent $2.2 Trillion, 16.2% of GDP, on Health Care in 2007
Here is a good blog post showing one great feature of the blogosphere (that term seems to have fallen out of use hasn’t it): interaction. It also shows that you have to think critically. You can’t just accept what you read (you never can, but that is even more true with blogs than it is with newspapers that at least have some standards normally). I tend to agree with this posts look at the data, though I have not examined the issue closely.
Bad Math, Bad Statistics: Trying to get a blogger to admit a mistake
1981: 229465714 * 8476.0 = 1.944 trillion
1992: 255029699 * 14847.0 = 3.786 trillion (94% gain)
2005: 292892127 * 25036.0 = 7.332 trillion (93.6% gain)
Er, doesn’t look like a lag to me. In fact, it looks like it’s doubling every 12-13 years just as much as GDP is. I also looked up total income statistics for the US, and found the following figures (source). (Note these figures are different. More on that later.)
1981: $2,580,600,000 (2.58 / 3.1 = 83% of GDP)
1992: $5,349,384,000 (more than double!) (5.34 / 6.2 = 86% of GDP)
2005: $10,252,973,000 (another double!) (10.25 / 12.4 = 82% of GDP)
Anyway it is a much more interesting argument than I would hear when I listened to TV “pundits” years ago spout meaningless talking points at each other. Granted they argument is not going to be studied as a wonderful example of how we should debate. Still it is much above what passes for debate from our politicians (yes this is more a sad commentary on how failed our politicians are than a statement of how marvelous the argument on the GDP issue is between the two bloggers).
Here is a math question for you, what has a bigger impact moving from 15 to 18 mpg or 50 to 100 mpg?
Related: Government Debt as a Percentage of GDP – USA Consumers Paying Down Debt – Is Productivity Growth Bad? – Americans are Drowning in Debt
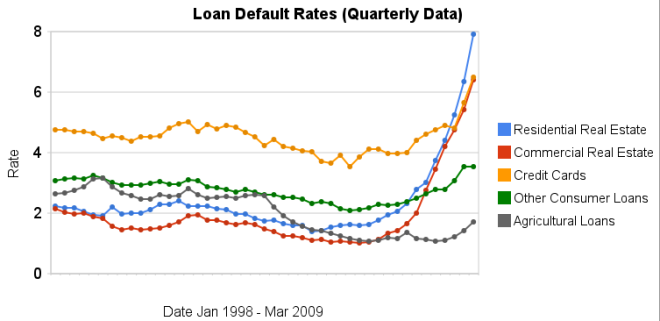 Chart showing loan default rates for real estate, consumer and agricultural loans for 1998 to 2009 by the Curious Cat Investing Economics Blog, Creative Commons Attribution, data from the Federal Reserve.
As you can see real estate default rates exploded in 2008. In the 4th quarter of 2007 residential default rates were 3.02% by the 4th quarter of 2008 they were 6.34% and in the 1st quarter of this year they were 7.91% (471 basis points above the 4th quarter of 2007). Commercial real estate default rates were at 2.74 in the 4th quarter of 2007, 5.43% in the fourth quarter of 2008 and 6.5% in the 1st quarter of 2009 (a 366 basis point increase).
Credit card default rates were much higher for the last 10 years (the 4-5% range while real estate hovered above or below 2%). In the last 2 quarters it has increased sharply. From 4.8% in the 3rd quarter 2008 to 5.66% in the 4th and 6.5% in the 1st quarter of 2009. The default rate on other consumer loans are up but nowhere near the amounts of real estate or credit cards.
Agricultural loan default rates are actually about as low now as they have every been 1.71%. That is up a bit from the 1.06% low the default rate hit in the 1st quarter of 2009 but actually lower than it was for half of the last decade (the last 5 years it has been lower but prior to that it was higher – in fact with higher default rates than either real estate loan category).
Related: Mortgage Rates: 6 Month and 5 Year Charts – Jumbo Loan Defaults Rise at Fast Pace – Continued Large Spreads Between Corporate and Government Bond Yields – Nearly 10% of Mortgages Delinquent or in Foreclosure
U.S. Job Report Suggests that Green Shoots are Mostly Yellow Weeds by Nouriel Roubini
It’s clear that even if the recession were to be over anytime soon – and it’s not going to be over before the end of the year – job losses are going to continue for at least another year and a half. Historically, during the last two recessions, job losses continued for at least a year and a half after the recession was over.
…
The latest figures – published this week – on mortgage delinquencies and foreclosures suggest a spike not only in subprime and near-prime delinquencies, but now also on prime mortgages. So the problems of the economy are significantly affecting the banking system.
…
So the outlook for the US and global economy remains extremely weak ahead. The recent rally in global equities, commodities and credit may soon fizzle out as an onslaught of worse- than-expected macro, earnings and financial news take a toll on this rally, which has gotten way ahead of improvement in actual macro data.
Certainly this is not a forecast that will make people happy. I agree that the expectations for a nice quick recovery have become too optimistic. I am far from certain what lies ahead but the second half of 2009 does not look to be very strong. It is still a time to be cautious.
Related: Jim Rogers on the Financial Market Mess (Oct 2008) – Beware of the Sucker’s Rally – USA Consumers Paying Down Debt – Investing quotations
Another wave of foreclosures is poised to strike
…
Mark Zandi of Moody’s Economy.com estimates that 15.4 million homeowners — or about 1 in 5 of those with first mortgages — owe more on their homes than they are worth.
…
Government and company reports show that the number of completed foreclosures nationwide slowed sharply late last year and into early this year, largely because of various moratoriums in effect during much of the first quarter.
But anecdotal reports indicate that foreclosure sales have started to climb again in the second quarter. And the pipeline is clearly getting fuller. In the first quarter, some 1.8 million homeowners nationwide fell behind on their loans by 60 to 90 days, a 15% increase from the prior quarter, according to Moody’s Economy.com. The research firm said that loan defaults rose sharply as well, to 844,000 in the first three months of this year.
…
Even as defaults among subprime borrowers have trended lower this year, newly initiated foreclosures involving prime mortgage loans saw a significant increase in the first quarter, jumping 21.5% from the fourth quarter, according to a government report of loan data from national banks and federally regulated thrifts.
This is more bad news for the economy. As I have been saying the economy is still in serious trouble. Cleaning up the damage caused by living beyond our means for decades does not get cleaned up quickly. This are actually going as well as could be hoped for, I think. We need to hope the remainder of this year sees the economy stabilize and then hope 2010 brings some good news.
Related: Nearly 10% of Mortgages Delinquent or in Foreclosure – Over Half of 2008 Foreclosures From Just 35 Counties – How Much Worse Can the Mortgage Crisis Get? (March 2008) – Mortgage Rates Falling on Fed Housing Focus