What Should You Do With a Check Out of the Blue?
The USA government is sending out checks to taxpayers in an effort to encourage spending which in turn will provide stimulus to the economy in the very short term. First, this is bad policy in my opinion. Second, if you support this policy the precondition is you run surpluses in order to pay for it when you want to carry out such a policy. They have not, instead they have run huge deficits. What they have chosen to do is spend huge amounts and have the taxes paid by the children and grandchildren of those the politicians are spending the money on today. I would support Keynesian government spending in a serious recession or depression – just not for a country already with enormous debts and in a very mild recession.
But ok, so the government chooses to spend your children’s taxes foolishly, what should you do now? This is very easy. Whatever is the wisest move for your personal financial situation for any windfall you receive, regardless of the source of that windfall. If all your savings needs are met there is nothing wrong with buying some toy. But most people need to pay off debt, build an emergency fund, save for retirement or something similar not get another toy. Of course would be nothing wrong with donating it Kiva, Trickle Up, the Concord Coalition or your favorite charity.
The politicians are acting like a 5 year old that wants a new toy. I can too get the new toy now :-O, Mommy you can use your credit card. So what if you already bought me so many toys you couldn’t afford by using your other credit cards and they won’t lend you any more money. Just get another one. Similar to how congress recently yet again increased the allowable federal debt limit to over $9,000,000,000,000.
The stimulus effect of spending is that if you actually purchase a new toy (say a TV), then the store needs to replace that TV so the factory makes another TV… The store, shipper, factory, supplier to the factory all pay staff to carry this out, those staff can buy new books, dishwasher… and the business may buy a new forklift or computer to keep up…
Read more
U.S. Consumer Borrowing Rose $5.2 Billion in February
$2.54 Trillion seems like a great deal to me. Based on a population of 300 million people that would mean $8,467 for every person in just personal debt. USA GDP = $13 trillion. USA federal debt = $9.4 trillion (based on the USA government accounting – so way understating the true debt). USA federal budget $3 trillion.
Related: Americans are Drowning in Debt – Too Much Personal Debt (UK, £1.3 trillion in 2006 – even more than the USA) – Incredibly Bad Customer Service from Discover Card
I think a country that is more than $500,000 in debt per household should not send out checks to taxpayers to try pretend they are doing something to help the economy. Just as I wouldn’t think some family with $20,000 in credit card debt should fix the problem by taking the family on a new credit card financed vacation. But if you are going to do so, then take Dan Ariely’s advice: Stimulus options should be tested first. His blog post on the topic, Do we know enough to give stimulus packages?
The next question, of course, is which delivery method to select. Here behavioral economics has been instructive as well. In particular, years of research have demonstrated over and over that our intuitions about the relative effectiveness of different approaches are often wrong. Given that the method of delivery could make a large difference, and given that our intuitions about their relative effectiveness could be wrong, what should we do?
One answer is to conduct an experiment, as this is the only method we have for testing what really works and what is likely to fail. In the same way that we force drug companies to test the efficacy of their drugs before rolling them onto the market, shouldn’t we ask the government to first test their ideas before they invest billions of dollars of our tax money on some stimulus packages?
Related: Politicians Again Raising Taxes On Your Children – Charge It to My Kids – Google: Experiment Quickly and Often
The day the dream of global free- market capitalism died
The lobbies of Wall Street will, it is true, resist onerous regulation of capital requirements or liquidity, after this crisis is over. They may succeed. But, intellectually, their position is now untenable.
The intellectually depravity of such claims were obvious well before. Two problems make that truth less important. First, few actually believe in intellectual rigor any longer. Second, huge payments to politicians from those wishing to receive special favors from the government work (not very surprisingly). So given the lack of intellect and the alternative of just rewarding those that pay you huge sums of money it is no surprise politicians turned against capitalism and instead gave favors to a few that paid them well.
Maybe the latest huge bailout will change how things are done. I doubt it. New rules will be put in place. Plenty of people will pay politicians plenty of money to assure their methods of subverting the intent of those rules are allowed to continue. To change things you would need to vastly improve the intellectual rigor of decision making. That is unlikely, but if it happens it will be plenty obvious from how debate is carried out.
Read more
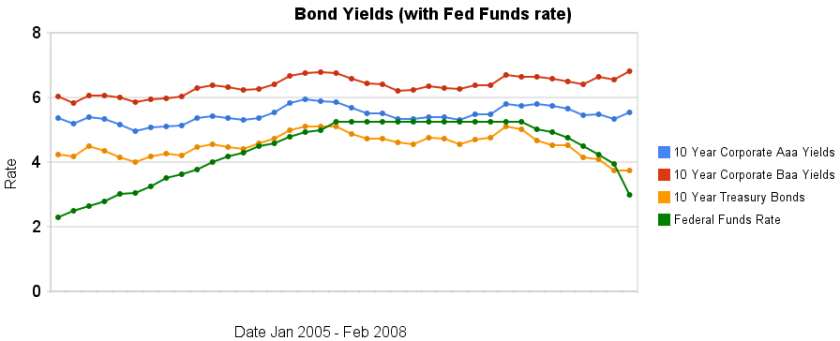
From January 2005 to July 2007 the Federal Funds Rate was steadily increased. The rate was held for a year. Since then the rate has been decreasing (dramatically, recently). As you can see from the chart, 10 year bond yields have been much less variable. The chart also shows 10 year corporate bond yields increasing in February when the federal funds rate fell 100 basis points.
Is the worst over, or just beginning?
…
If rates continue to fall, they could hit not only a new low for the year – the 10-year briefly touched 3.28% in January – but could come close to falling below the 3.07% level they hit in June 2003, which was a 45-year low at the time.
Treasury bond yields are down but a huge part of the reason is a “flight to quality,” where investors are reluctant to hold other bonds (so they buy treasuries when they sell those bonds). Therefore other bond yields (and mortgage rates) are not decreasing (the data in the chart is a bit old – the yields may well decrease some for both 10 year bonds once the March data is posted, though I would expect the spread between treasuries be larger than it was in January).
Data from the federal reserve – corporate Aaa – corporate Baa – ten year treasury – fed funds
Related: 30 Year Fixed Mortgage Rates versus the Fed Funds Rate – After Tax Return on Municipal Bonds
Bill Gates Issues Call For Kinder Capitalism:
…
Among the fixes he plans to call for: Companies should create businesses that focus on building products and services for the poor. “Such a system would have a twin mission: making profits and also improving lives for those who don’t fully benefit from market forces,” he plans to say.
Related: Appropriate Technology – Using Capitalism to Make the World Better – Data Visualization Example (Hans Rosling) – Design for the Unwealthiest 90 Percent
Vacant Homes in U.S. Climb to Most Since 1970s With Ghost Towns
…
About 370,000 new homes are for sale because people who initially contracted to buy them backed out, according to estimates in a Feb. 15 report from analysts at New York-based CreditSights Inc. An additional 216,000 homes are under construction, according to Commerce Department data.
In January 1973, the number of finished new homes for sale was 97,000, when the U.S. population was about 212 million, according to the U.S. Census Bureau. In December 2007, 197,000 completed homes were on the market and in January 2008 there were 195,000. The current population is 303.5 million.
Home prices may fall at least 8 percent nationwide and by as much as 26 percent from the third quarter of 2007 before hitting bottom, according to a Feb. 13 report from New York- based Deutsche Bank AG analyst Karen Weaver, the firm’s global head of securitization research.
…
“The builders are looking for ways to accelerate sales and get inventory moving,”
The news certainly continues to be quite bad on the home front.
Related: Housing Inventory Glut (August 2007) – Home Price Declines Exceeding 10% Seen for 20% of Housing Markets – Ever Larger Houses – Exurbs Hardest Hit in Recent Housing Slump
Data from the Commonwealth fund report, Toward Higher-Performance Health Systems: Adults’ Health Care Experiences in Seven Countries, 2007:
| Australia | Canada | Germany | Netherlands | New Zealand | UK | USA | |
| National health spending – Percent of GDP | 9.5% | 9.8% | 10.7% | 9.2% | 9.0% | 8.3% | 16.0% |
| Percent uninsured | 0 | 0 | <1 | <2 | 0 | 0 | 16 |
| Last time you were sick or needed care, how quickly could you get an appointment to see a doctor? | |||||||
| Same day | 42 | 22 | 55 | 49 | 53 | 41 | 30 |
| Next day | 20 | 14 | 10 | 21 | 22 | 17 | 19 |
| 2-5 days | 26 | 26 | 10 | 17 | 17 | 26 | 25 |
| 6 or more days | 10 | 30 | 20 | 5 | 4 | 12 | 20 |
| Overall health system views | |||||||
| Only minor changes needed, system works well | 24 | 26 | 20 | 42 | 26 | 26 | 16 |
| Fundamental changes needed | 55 | 60 | 51 | 49 | 56 | 57 | 48 |
| Rebuild completely | 18 | 12 | 28 | 9 | 17 | 15 | 34 |
Related: Measuring the Health of Nations – USA Paying More for Health Care – Traveling for Health Care – resources for improvement health system performance
Jimmy Rodgers is one of the most successful investors ever. He and George Soros were partners during the amazing run with Quantum Fund (up over 4000% in 10 years) and he has been successful since. This interview provides his current thoughts – ‘It’s going to be much worse’
Rogers looks at the Fed’s willingness to add liquidity to an already inflationary environment and sees the history of the 1970s repeating itself. Does that mean stagflation? “It is a real danger and, in fact, a probability.”
One smart investor, no matter how smart, will have many wrong guesses about the future. Still he is someone worth listening to.
Related: Investment Biker – Charge It to My Kids – Buffett’s 2007 Letter to Shareholders
Here is updated data from the UN on manufacturing output by country. China continues to grow amazingly moving into second place for 2006. UN Data, in billions of current US dollars:
| Country | 1990 | 2000 | 2004 | 2005 | 2006 | |
|---|---|---|---|---|---|---|
| USA | 1,040 | 1,543 | 1,545 | 1,629 | 1,725 | |
| China | 143 | 484 | 788 | 939 | 1096 | |
| Japan | 808 | 1,033 | 962 | 954 | 929 | |
| Germany | 437 | 392 | 559 | 584 | 620 | |
| Italy | 240 | 206 | 295 | 291 | 313 | |
| United Kingdom | 207 | 230 | 283 | 283 | 308 | |
| France | 223 | 190 | 256 | 253 | 275 | |
| Brazil | 117 | 120 | 130 | 172 | 231 | |
| Korea | 65 | 134 | 173 | 199 | 216 | |
| Canada | 92 | 129 | 165 | 188 | 213 | |
| Additional countries of interest – not the next largest | ||||||
| Mexico | 50 | 107 | 111 | 122 | 136 | |
| India | 50 | 67 | 100 | 118 | 130 | |
| Indonesia | 29 | 46 | 72 | 79 | 103 | |
| Turkey | 33 | 38 | 75 | 92 | 100 | |