China’s economy continues to grow quickly. It looks as though that, along with the slump in US car sales, likely will lead to China taking the world sales lead for cars (I would imagine for the first time ever the USA has not held this title). China 2009 Vehicle Sales May Rise 28% on Stimulus:
China has boosted auto sales this year through tax cuts and subsidies as a part of a wider 4 trillion yuan ($586 billion) stimulus that has shielded the country from the worst of the global recession. U.S. sales have slumped 28 percent, pushing the old GM and Chrysler LLC into bankruptcy. Last year’s total was 13.2 million, compared with 9.4 million in China.
Partially due to the strong internal Chinese demand (and partially due to Chinese regulation) India actually exports more cars than China. 5 times as many cars are purchased in China as are bought in India.
Indian Car Exports Beat China’s
…
In contrast, China’s exports slumped 60 percent to 164,800 between January and July, according to government data. Vehicles produced in Thailand for export declined 43 percent to 263,768, according to the Thai Automotive Club.
South Korean exports dropped 31 percent to 1.12 million units, according to the Korea Automobile Manufacturers Association. Japan, the world’s largest automobile producer and exporter, shipped 1.77 million cars, trucks and buses.
Related: The Relative Economic Position of the USA is Likely to Decline – Manufacturing Cars in the USA – Rodgers on the US and Chinese Economies
The unemployment rate in the USA continued the climb toward 10% in August in the aftermath of the credit crisis. Nonfarm payroll employment decline in August, by 216,000 more jobs, and the unemployment rate rose to 9.7%, the U.S. Bureau of Labor Statistics reported today. Since December 2007, employment has fallen by 6.9 million jobs.
In August, the number of unemployed persons increased by 466,000 to 14.9
million, and the unemployment rate rose to 9.7%. The unemployment rates for adult men (10.1%), whites (8.9%), and Hispanics (13.0%) rose in August. The jobless rates for adult women (7.6%), teenagers (25.5%), and blacks (15.1%) were little changed over the month.
The civilian labor force participation rate remained at 65.5% in August. The employment-population ratio, at 59.2%, edged down over the month and has declined by 3.5 percentage points since the recession began in December 2007.
In August, the number of persons working part time for economic reasons was little changed at 9.1 million. These individuals indicated that they were working part time because their hours had been cut back or because they were unable to find a full-time job.
In August, manufacturing employment continued to trend downward, with a decline of 63,000. The pace of job loss has slowed throughout manufacturing in recent months. Employment in health care continued to rise in August (28,000), with gains in ambulatory care and in nursing and residential care. Health care has added 544,000 jobs since the start of the recession.
In August, the average workweek for production and nonsupervisory
workers on private nonfarm payrolls was unchanged at 33.1 hours.
The manufacturing workweek and factory overtime also showed no
change over the month (at 39.8 hours and 2.9 hours, respectively).
Related: Unemployment Rate Drops Slightly to 9.4% – posts on employment – May 2009 Unemployment Rate Jumps to 9.4% – California Unemployment Rate Climbs to 10.5 Percent (March 2009)
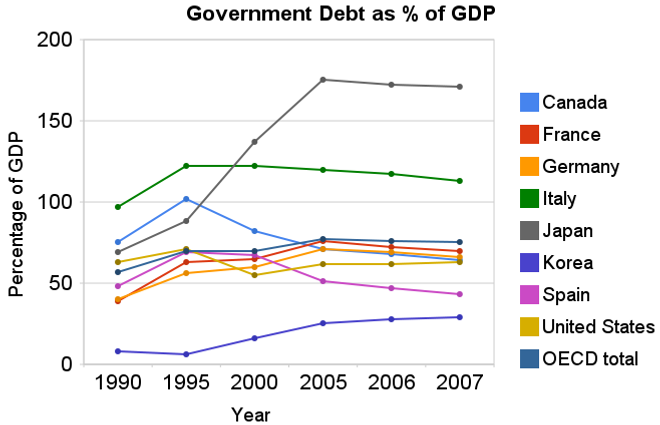
 Chart showing government debt as a percentage of GDP by Curious Cat Investing Economics Blog, Creative Commons Attribution, data from OECD, Sept 2009.
For 2007 most countries slightly decreased their government debt to GDP ratio – as economic growth exceeded debt growth. The OECD is made up of countries in Europe and the USA, Japan, Korea, Australia, New Zealand and Canada. The overall OECD debt to GDP ratio decreased from 77% in 2005 to 75% in 2007. The USA moved in the opposite direction increasing from 62% to 63%: still remaining far below the OECD total. Most likely 2008, 2009 and 2010 will see both the USA and other OECD national dramatically increase the debt burden.
Compared to the OECD countries the USA is actually better than average. The chart shows the percentage of GDP that government debt represents for various countries. The USA ended 2007 at 63% while the overall OECD total is 75%. In 1990 the USA was at 63% and the OECD was at 57%. Japan is the line way at the top with a 2007 total of 171% (that is a big problem for them). Korea is in the best shape at just a 29% total in 2007 but that is an increase from just 8% in 1990.
Related: Government Debt as a Percentage of GDP Through 2006 – Oil Consumption by Country in 2007 – Federal Deficit To Double This Year – Politicians Again Raising Taxes On Your Children – True Level of USA Federal Deficit – Top 12 Manufacturing Countries in 2007
Read more
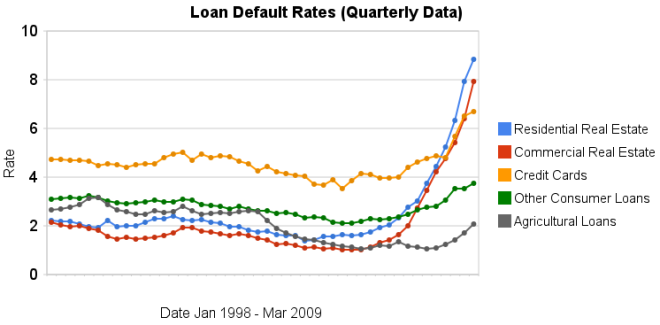
 Chart showing loan delinquency rates for real estate, consumer and agricultural loans for 1998 to 2009 by the Curious Cat Investing Economics Blog, Creative Commons Attribution, data from the Federal Reserve.
Delinquency rates on commercial (up another 151 basis points) and residential (93 basis points) real estate continued to increase dramatically in the second quarter. Credit card delinquency rates increased but only by 20 basis points.
Real estate delinquency rates exploded in 2008. In the 4th quarter of 2007 residential delinquency rates were 3.02% by the 4th quarter of 2008 they were 6.34% and in the 2nd quarter of this year they were 8.84% (582 basis points above the 4th quarter of 2007). Commercial real estate delinquency rates were at 2.74% in the 4th quarter of 2007, 5.43% in the fourth quarter of 2008 and 7.91% in the 2nd quarter of 2009 (a 517 basis point increase).
Credit card delinquency rates were much higher than real estate default rates for the last 10 years (the 4-5% range while real estate hovered above or below 2%). Now they are over 200 and 300 basis points bellow residential and commercial delinquency rates respectively. From 4.8% in the 3rd quarter 2008 to 5.66% in the 4th and 6.5% in the 1st quarter of 2009.
The delinquency rate on other consumer loans and agricultural loan delinquency rates are up but nowhere near the amounts of real estate or credit cards.
As I wrote recently bond yields in the last few months show a dramatic increase in investor confidence for corporate bonds.
Related: Loan Delinquency Rates: 1998-2009 – The Impact of Credit Scores and Jumbo Size on Mortgage Rates – 30 Year Mortgage Rate and Federal Funds Rate Chart
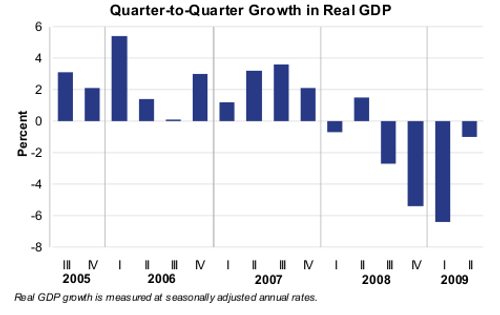
 Chart from the Bureau of Economic Analysis showing the quarter to quarter growth in real GDP from 2005-2009.
Current-dollar GDP — the market value of the nation’s output of goods and services — decreased 1.0%, or $34.7 billion, in the second quarter to a level of $14,143.3 billion. In the first quarter, current-dollar GDP decreased 4.6%, or $169.3 billion.
More details on 2nd quarter, 2009 GDP.
Related: First Quarter GDP 2009 down 6.1% – Economists Raise Projections for Second Half of 2009 – What the Bailout and Stimulus Are and Are Not
The largest oil consuming countries (and EU), in millions of barrels per day for 2007. China increased use by 1 billion barrels a day, the USA and Europe decreased use by 100 million barrels a day from our post last year on Oil Consumption by Country.
| Country | consumption | % of oil used | % of population | % of World GDP | % of oil used in 2006 |
|---|---|---|---|---|---|
| USA | 20.7 | 24.3 | 4.5 | 21.0 | 25.9 |
| European Union | 14.4 | 16.9 | 7.4 | 21.9 | 18.1 |
| China | 7.9 | 9.2 | 19.9 | 10.8 | 8.6 |
| Japan | 5.0 | 5.8 | 1.8 | 6.5 | 6.7 |
| India | 2.7 | 3.1 | 17.3 | 4.5 | 3.0 |
| Russia | 2.7 | 3.1 | 2.0 | 3.1 | 3.6 |
| Germany | 2.5 | 2.8 | 1.2 | 4.2 | 3.3 |
| Brazil | 2.4 | 2.7 | 2.9 | 2.8 | 2.6 |
| Canada | 2.4 | 2.7 | 0.4 | 1.9 | 2.9 |
| Mexico | 2.1 | 2.4 | 1.6 | 2.0 | 2.6 |
| South Korea | 2.1 | 2.4 | 0.7 | 1.8 | 2.7 |
Data is from CIA World Factbook 2009 (downloaded August 2009). GDP calculated using purchasing power parity from 2008 fact book with estimated 2007 data.
Related: Government Debt as a Percentage of GDP – Global Manufacturing Production by Country – Manufacturing Contracting Globally (March 2009)
China’s recovery: Is it for real?
…
Investors don’t need to answer or even be interested in those philosophical questions. But they do need to consider the possibility that China’s huge acceleration in its growth rate is merely an artifact of the way the country keeps its books.
Economic data is often messy and confusing. The data itself often has measurement error. The actual aim is often not exactly what people think. And the data is often delayed so it provides a view of the situation, not today, but in the past and guesses must be made about what that says about today and the future.
And on top of those factors many countries feel significant internal pressures to report numbers that make the current economy look good. This is just another factor investor must consider when looking to make investments and evaluate economic conditions.
It seems to me the Chinese recovery does look real. How strong the economy will be 6 months from now is less clear but right now things look positive to me.
Related: posts on economic data – What Do Unemployment Stats Mean? – China Manufacturing Expands for the Fourth Straight Month (Jun 2009) – A Bull on China
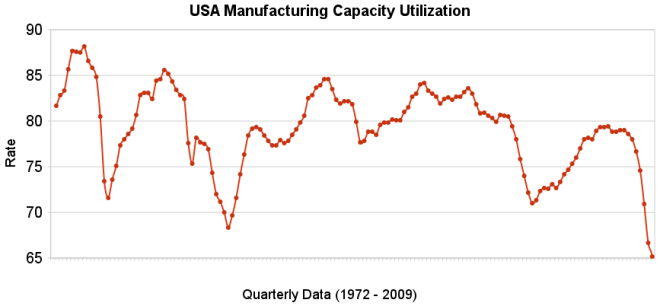
 The chart shows the capacity utilization rate in the USA. By Curious Cat Investing Economics Blog, Creative Commons Attribution, data from the Federal Reserve.
Industrial production increased .5% in July and capacity utilization rate increased to 68.5% from an all time low of 68.1%. Capacity utilization has averaged 80.9% from 1972 to today.
Manufacturing output increased 1.0% in July but remained 14.4% lower than its year-earlier level. The factory operating rate rose to 65.4% in July, 70 basis points above the historical low recorded in June; the series begins in 1948. Production in durable goods industries advanced 2.2% in July. In addition to the sharp increase in motor vehicles and parts output, large production gains occurred for nonmetallic mineral products and for primary metals. The indexes for wood products, computer and electronic products, aerospace and miscellaneous transportation equipment, furniture and related products, and miscellaneous goods also rose. The indexes for fabricated metal products, machinery, and electrical equipment declined.
The production of nondurable goods fell 0.1% in July. The indexes for textile and product mills and for printing and support recorded sizable declines; the indexes for food, beverages, and tobacco and for petroleum and coal products also declined. The output of paper, of chemicals, and of plastic and rubber products increased.
The index for other manufacturing, which consists of publishing and logging, was down 0.6% in July.
The output of electric and gas utilities decreased 2.4%, and the operating rate for utilities dropped 21 basis points, to 77.6%. Mining production moved up 0.8%; its utilization rate in July, at 81.7%, was 59 basis points below its 1972-2008 average.
Data from the St. Louis Federal Reserve and Federal Reserve August 14th Industrial Production and Capacity Utilization press release.
Related: Loan Default Rates: 1998-2009 – Government Debt as a Percentage of GDP – USA Spent $2.2 Trillion, 16.2% of GDP, on Health Care in 2007
Read more
On the heels of the Japanese economy shrinking at 12.7% rate 2 quarters ago, the Japanese economy grew at a 3.7% annual rate in the second quarter. Japan is the 2nd largest economy (after the USA). Japan’s economy leaves recession:
…
Japan is heavily reliant on its exports so growth overseas could bode well for its recovery.
…
The French and German economies both grew by 0.3% between April and June, bringing to an end recessions in Europe’s largest economies that have lasted a year. Analysts had not expected the data, suggesting recovery could be faster than previously expected.
And Hong Kong recorded growth of 3.3% in the three months from April to June. That data was also better than had been expected, with the government subsequently increasing its forecast for growth in the whole year.
The global economic recovery seems to be taking shape more quickly than anticipated. However, we are still far from in the clear. The risks to short term economic recovery are still great. And the largest long term economic problems for the USA (massive federal debt, huge consumer debt [both the government and the people living far beyond their means] and an very expensive and harmful health care system) have not been addressed. If we are very very lucky the increased saving rate in the last 6 months will continue but it is very questionable if that will continue.
Related: Manufacturing Employment Data, 1979 to 2007 – Government Debt as a Percentage of GDP – Politicians Again Raising Taxes On Your Children (Jan 2008)
Ok, maybe moving to lower your cell phone bill would be a bit extreme. But the cost of cell phone service is almost 5 times as high in the USA as in Finland:
Mobile phone calls lowest in Finland, Netherlands and Sweden
Comparing prices on a medium-use basis for a package of 780 voice calls, 600 short texts (SMS), and eight multimedia (MMS) messages, the survey found monthly prices ranged from 11 to 53 US dollars across countries as of August 2008.
…
The OECD Communications Outlook says between 2006 and 2008 mobile phone call prices fell on average by 21% for low usage consumers, 28% for medium usage and by 32% for subscribers with the highest consumption patterns.
Related: Kiss Your Phone Bill Good-bye – money saving ideas – Investing dictionary