The health care system in the USA is broken, as I have written about previously: USA Paying More for Health Care, International Health Care System Performance… One of the many problems created by the current system is ruined person finances for millions of people in the USA due to health care costs. The Rising Costs of Care And a Failing Economy Drive More Americans Into Medical Debt
…
Medical debt can quickly snowball. Consumers with unpaid bills can wind up in court defending themselves against lawsuits filed by doctors and hospitals, which typically charge the uninsured full price for care, without the hefty discounts negotiated by health plans. Debtors’ wages can be garnished, liens can be placed on their homes, and their future job and housing prospects torpedoed by bad credit ratings.
…
Unwilling to wait for federal action, a handful of states, most notably Massachusetts, have passed laws designed to expand health coverage or to protect medical debtors. An Illinois law passed last year caps rates that hospitals can charge the uninsured, while a New York statute bars foreclosures intended to pay off medical bills.
Purchasing health insurance against the risk of medical costs is critical to any financial plan. The concept (buying health insurance) is simple but securing that coverage is not as easy as knowing it is required for a sensible financial plan.
Related: Broken Health Care System: Self-Employed Insurance – Resources Focused on Improving the Health Care System – Excessive Health Care Costs
$30.1 trillion in stock market valuation was wiped out last year – Journal of a Plague Year: Faith in Markets Cracks Under Losses:
…
Lehman Brothers Holdings Inc., with assets of $639 billion, filed the largest bankruptcy in U.S. history on Sept. 15. Its creditors may have lost as much $75 billion, the firm’s chief restructuring officer said.
Bear Stearns Cos. was taken over by JPMorgan Chase & Co. in March after a funding crisis triggered by losses from subprime- mortgage investments. Merrill Lynch & Co., facing a crisis of its own, sold itself to Charlotte, North Carolina-based Bank of America Corp. And the last two major investment banks, Goldman Sachs Group Inc. and Morgan Stanley, converted to bank holding companies and got capital injections from the U.S. government.
2008 was quite a memorable year in the markets. What the markets will do this year is hard to know. But the economy is likely to be very weak. Job losses will increase. If we are lucky the economy will be picking up by the end of the year. A huge problem is we have been living well beyond our means for decades. And now we are selling out even more of our children and grandchildren’s future to pay for the extravagance of those last few decades. How costly our credit-card-like financing of government bailouts is going to be is the most important issue I believe.
There is nothing wrong with spending money you saved for a raining day when that day comes. There is a big problem (for your future) taking our more credit cards to spend money you didn’t bother to save. You might have to do so, but the costs you are heaping on your future is very high (and for the economy overall many of those costs will be borne by children not yet born).
Related: The Economy is in Serious Trouble – Crisis May Push USA Federal Deficit to Above $1 Trillion for 2009 – What Should You Do With Your Government “Stimulus” Check? – Over 500,000 Jobs Disappeared in November
The percentage of loans in the foreclosure process at the end of the third quarter was 2.97 percent, an increase of 22 basis points from the second quarter of 2008 and 128 basis points from one year ago. The percentage of loans in the process of foreclosure set a new record this quarter, to 1.35 million.
Mortgages are counted as delinquent or in foreclosure (once they are in foreclosure they are not counted as delinquent). So the total percentage of mortgages not being paid by the homeowner is 2.97% (in foreclosure) + 6.99% (delinquent) = 9.96%. That is amazingly bad. In February of 2007 I wrote about this and the delinquency rate was 4.7% which sounded pretty bad to me. Amazingly 4.4% is a historic low for this figure. Can you believe 1/25 mortgages is delinquent and that is as good as we ever get? That is pretty shocking to me.
The seasonally adjusted total delinquency rate is now the highest recorded in the Mortgage Bankers Association survey. The seasonally adjusted delinquency rate increased 41 basis points to 4.34 percent for prime loans, increased 136 basis points to 20.03 percent for subprime loans, increased 29 basis points to 12.92 percent for FHA loans, and increased 46 basis points to 7.28 percent for VA loans.
The percent of loans in the foreclosure process increased 16 basis points to 1.58 percent for prime loans, and increased 74 basis points for subprime loans to 12.55 percent. FHA loans saw an eight basis point increase in the foreclosure inventory rate to 2.32 percent, while the foreclosure inventory rate for VA loans increased 13 basis points to 1.46 percent.
Since loans that would have gone into foreclosure in the past are being kept out of foreclosure due to some programs ( ) the rate or seriously delinquent is a useful measure of serious problems. Seriously delinquent mortgages are 90 days past due. The rate increased 52 basis points for prime loans to 2.87 percent, increased 171 basis points for subprime loans to 19.56 percent, increased 62 basis points for FHA loans to 6.05 percent, and increased 45 basis points for VA loans percent to 3.45 percent.
Compared to a year ago: the seriously delinquent rate was 156 basis points higher for prime loans and 818 basis points higher for subprime loans. The rate also increased 51 basis points for FHA loans and 89 basis points for VA loans.
Related: Homes Entering Foreclosure at Record (Sep 2007) – Foreclosure Filings Continue to Rise – How Much Worse Can the Mortgage Crisis Get? – How Not to Convert Equity
Many Experts Say Health-Care System Inefficient, Wasteful
“We’re not getting what we pay for,” says Denis Cortese, president and chief executive of the Mayo Clinic. “It’s just that simple.”
“Our health-care system is fraught with waste,” says Gary Kaplan, chairman of Seattle’s cutting-edge Virginia Mason Medical Center. As much as half of the $2.3 trillion spent today does nothing to improve health, he says.
Not only is American health care inefficient and wasteful, says Kaiser Permanente chief executive George Halvorson, much of it is dangerous.
…
The United States today devotes 16 percent of its gross domestic product to medical care, more per capita than any other nation in the world. Yet numerous measures indicate the country lags in overall health: It ranks 29th in infant mortality, 48th in life expectancy and 19th out of 19 industrialized nations in preventable deaths.
One way to reconfigure health spending is to shift large sums into prevention and wellness, said Reed Tuckson, a physician and executive vice president at UnitedHealth Group in Minneapolis. The idea is to tackle the handful of preventable, chronic illnesses such as heart disease and diabetes that account for 75 percent of health-care costs.
…
the Dartmouth team concluded that as much as 30 percent of medical spending — or $700 billion — does nothing to improve care.
I continue to write about this serious problem for the USA. The credit crisis is an immediate crisis (with roots in many bad decisions over the last decade). But the health care crisis is just as deadly. The health care crisis is like a person smoking. It might not kill the economy immediately, but the huge harm down to the economy by the broken healthcare system is like a cancer on the economy.
Previous posts on problems and suggestions for improvement: PBS Documentary on Improving Hospitals – site and books on improving the health care system – International Health Care System Performance – USA Health Care Improvement – Broken Health Care System: Self-Employed Insurance – Excessive Health Care Costs – USA Spent $2.1 Trillion on Health Care in 2006
Jobless Rate Rises to 6.7% in November
…
The decline, the largest one-month loss since December 1974, was fresh evidence that the economic contraction accelerated in November, promising to make the current recession, already 12 months old, the longest since the Great Depression. The previous record was 16 months, in the severe recessions of the mid-1970s and early 1980s.
…
The manufacturing sector has been particularly hard hit, losing more than half a million jobs this year. That is nearly half the 1.2 million jobs lost since employment peaked in December and, in January, began its uninterrupted decline. The cutbacks seem likely to accelerate as the three Detroit automakers close more factories and shrink payrolls even more
…
With all this in mind, and particularly the shrinking employment rolls, economists are estimating that the gross domestic product is contracting at an annual rate of 4 percent or more in the fourth quarter, after a decline of 0.3 percent in the third quarter.
The news was even worse than the anticipated 350,000 losses. And Previous months figures were adjusted from 240,000 losses in October to 320,00 and from 284,000 in September to 403,000. And these numbers are on an already extremely poor job picture the previous 7 years. One of the great strengths of the US economy over the last 50 years has been job creation. We know we are in for serious problems, the question is how serious and how long. One of the most important gages of that will be how many jobs are lost.
When job losses stop and job gains start (in the aggregate, for the entire economy) it will be a very positive sign. Normally jobs are a lagging indicator, meaning job data lags the actual economy. Job losses will not increases until after the economy starts to grow. Of course, economic data doesn’t always fit the conventional wisdom.
This is one more piece of evidence that the economy is not looking good. And 2009 is likely to be a bad year for the economy overall.
Related: Bad News on Jobs (Sep 2008) – What Do Unemployment Stats Mean? – The Economy is in Serious Trouble – Financial Market Meltdown
Continuation of: USA Manufacturing is Healthy
The real problem with the USA economy is that a country cannot live beyond its means forever. Those living in USA have consumed far more than they have produced for decades. That is not sustainable. The living beyond our means is mainly due to massively increased consumption, not shrinking output (in manufacturing or service). One, of many examples, of the increased consumption is average square footage of single-family homes in the USA: 1950 – 983; 1970 – 1,500; 1990 – 2,080; 2004 – 2,349.
In case it isn’t totally obvious to you. You don’t fix this problem by encouraging more spending and borrowing: either by the government or by consumers. The long term problem for the USA economy is that people have consuming more than they have been producing. Personally, as this continues you reach a point where getting another credit card does not work. The same holds true for the collective health of a country. A country cannot solve the problem of having bills come due from decades of living beyond its means by charging more so that they can continue to live beyond their means.
Where the USA is in the continuum, is hard for me to judge. For the sack of illustration, lets say a consumer can get to 10 cards before they finally fail. If the consumer reaches the limit on 2 credit cards they have the choice to continue to the party by getting another credit card. Or they have the choice of addressing the situation they have gotten themselves into. If they decide to become responsible they have a challenge but one they can endure with some hardships.
If they press on to 5 credit cards and then max them out they come to the same decision. Dig themselves deeper in debt to avoid the problem today or live up their past behavior and become responsible. The work they have ahead of themselves is much more challenging than if they had started working on the problem when they only had 2 cards.
If they press on to 9 cards and now have the decision again. The effort to find a solution may be almost impossible. Borrow more to pay for past mistakes while maintaining some expenditures may be possible (but they will have to live on less than they earn). By the time you are this far down the failed path you have so much going to pay for your past bills you can’t spend even close to what you currently earn on current expenses. Letting yourself get to this point is very bad. And most likely as a person you will go bankrupt.
Read more
When looking at the long term data, USA manufacturing output continues to increase. For decades people have been repeating the claim that the manufacturing base is eroding. It has not been true. I realize the economy is on weak ground today, I am not talking about that, I am looking at the long term trends.
The USA manufactures more than anyone else – by far. The percentage of total global manufacturing is the same today it was two decades ago (and further back as well). For decades people have been saying the USA has lost the manufacturing base – it just is not true. No matter how many times they say it does not make it true. It is true since 2000 the USA increase in manufacturing output (note not a decrease) has not kept pace with global grown in manufacturing output (global output in that period is up 47% and the USA is up 19% – Japan is down 10% for that period).
I would guess 20 years from today the USA will have a lower percentage of worldwide manufacturing. But I don’t see any reason believe the USA will see a decline in total manufacturing output. I just think the rest of the world is likely to grow manufacturing output more rapidly.
Looking at a year or even 2 or 3 years of manufacturing output data leaves a great deal of room to see trends where really just random variation exists. Even for longer periods trends are hard to project into the future.
Conventional wisdom is correct about China growing manufacturing output tremendously. China has grown from 4% of the output of the largest manufacturing companies in 1990 to manufacturing 16% of the total output in China today. That 12% had to come from other’s shares. And given all you hear from the general press, financial press, politicians, commentators… you would think the USA must have much less than China today, so may 10% and maybe they had 20% in 1990. When actually in 1990 the USA had 28% and in 2007 they had 27%.
Manufacturing jobs are not moving oversees. Manufacturing jobs are decreasing everywhere.
Read more
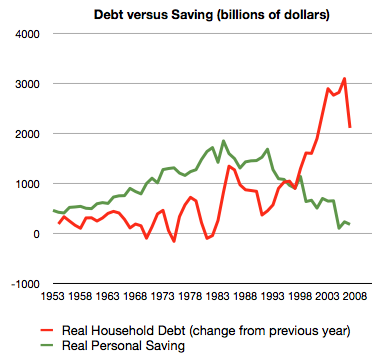
The whole sorry mess in one picture (including chart) by Philip Brewer
…
Starting back in about 2005, the American consumer reached the point that they could no longer service ever-increasing amounts of debt. That led to the housing bubble popping. The result is what you can see in the last datapoint on the graph–less new borrowing in 2007.
Related: $2,540,000,000,000 in USA Consumer Debt – Americans are Drowning in Debt – save an emergency fund – Financial Illiteracy Credit Trap – posts on saving money
It doesn’t take much effort to notice the economic news is increasingly dire. And this is not just a few alarmist reports, the economy is in serious trouble. The decades of spending beyond their means (for consumers and those the consumers elected to run government) are creating a very difficult situation. And the credit crisis precipitating the current slide has brought to light many failures to properly regulate the economy. U.S. Slump May Be Longest in Decades as Growth Fell Off ‘Cliff’
The implosion of credit markets last month will cause the economy to shrink at a 3 percent annual rate in the fourth quarter and decline at a 1.5 percent pace in the first three months of 2009, according to the median estimate of 59 economists surveyed Nov. 3 to Nov. 11. Following last quarter’s 0.3 percent drop, the slump would be the longest since 1974-75.
…
Falling demand will cause an even bigger increase in unemployment than projected last month. Economists surveyed forecast the jobless rate will rise to 7 percent in the first quarter of 2009, up from last month’s forecast of 6.6 percent. The rate will climb to 7.7 percent by the end of 2009, the highest level since 1992, the survey showed.
The jobless rate rose to 6.5 percent in October, the highest since 1994
There is little doubt the economy is in for serious trouble. What investment moves are wise now is less obvious. I have been buying during the decline and continue to do so. I bought some Google yesterday at the same price I first bought Google for several years ago. I think in 10 years that will pay off quite well, but time will tell. My purchases of Google earlier this year would obviously have been better if I had made them yesterday than when I did.
I discussed the Economic Crisis on my Curious Cat Management Blog last month:
One of the challenges with personal financial matters is they are by nature long term issues. What you did over the last 5 years cannot be fixed in a few weeks, most likely it takes years.
Related: Stock Market Decline – Bad News on Jobs
Singapore is again ranked first for Ease of Doing Business by the World Bank. For some reason they call the report issued in any given year as the report for the next year (which makes no sense to me). The data shown below is for the year they released the report.
| Country | 2008 | 2007 | 2006 | 2005 |
|---|---|---|---|---|
| Singapore | 1 | 1 | 1 | 2 |
| New Zealand | 2 | 2 | 2 | 1 |
| United States | 3 | 3 | 3 | 3 |
| Hong Kong | 4 | 4 | 5 | 6 |
| Denmark | 5 | 5 | 7 | 7 |
| United Kingdom | 6 | 6 | 6 | 5 |
| Ireland | 7 | 8 | 10 | 10 |
| Canada | 8 | 7 | 4 | 4 |
| other countries of interest | ||||
| Japan | 12 | 12 | 11 | 12 |
| Germany | 25 | 20 | 21 | 21 |
| France | 31 | 31 | 35 | 47 |
| Korea | 23 | 30 | 23 | 23 |
| Mexico | 56 | 44 | 43 | 62 |
| China | 83 | 83 | 93 | 108 |
| India | 122 | 120 | 134 | 138 |
| Brazil | 125 | 122 | 121 | 122 |
The rankings include ranking of various aspects of running a business. Some rankings for 2008: starting a business (New Zealand 1st, Singapore 10th, USA 6th, Japan 64th), Dealing with Construction Permits (St. Vincent and the Grenadines 1st, Singapore and New Zealand 2nd, USA 26th, China 176th), Employing Workers (Singapore and the USA 1st, Germany 142, Korea 152), protecting investors (New Zealand 1st, Singapore 2nd, Hong Kong 3rd, Malaysia 4th, USA 5th), enforcing contracts (Singapore 1, Hong Kong 2, USA 6, China 18), getting credit (Malaysia 1; UK and Hong Kong 2; Singapore, New Zealand and USA 5th), paying taxes (Maldives 1, Hong Kong 3, USA 46, Japan 112, China 132).
These rankings are not the final word on exactly where each country truly ranks but they do provide a valuable source of information. With this type of data there is plenty of room for judgment and issues with the data. Several of my posts, from my other blogs, that I recommend on this topic: The Future is Engineering, Science and Engineering in Global Economics Read more