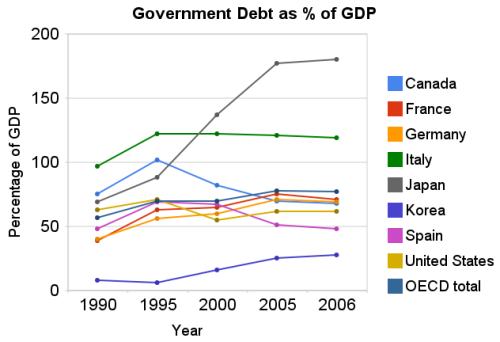
 Chart showing government debt as a percentage of GDP by Curious Cat Investing Economics Blog, Creative Commons Attribution, data from OECD, March 2009.
The USA federal government debt is far too large, in my opinion. We have been raising taxes on future taxpayers for several decades, to finance our current spending. Within reason deficit spending is fine. What that reasonable level is however, is not easy to know. One big problem with the past few decades is that during very prosperous economic times we spent money that we didn’t have, choosing to raise taxes on the future (instead of either not spending as much or paying for what we were spending by raising taxes to pay for current spending).
By not even paying for what we are spending when times were prosperous we put ourselves in a bad situation when we have poor economic conditions – like today. If we were responsible during good economic times (and at least paid for what we spent) we could have reduced our debt as a percentage of GDP. Even if we did not pay down debt, just by not increasing the outstanding debt while the economy grew the ratio of debt to GDP would decline. Then when times were bad, we could afford to run deficits and perhaps bring the debt level up to some reasonable level (maybe 40% of GDP – though it is hard to know what the target should be, 40% seems within the realm of reason to me, for now).
There is at least one more point to remember, the figures in the chart are based on reported debt. The USA has huge liabilities that are not accounted for. So you must remember that the actually debt is much higher than reported in the official debt calculation.
Now on to the good news. As bad as the USA has been at spending tomorrows increases in taxes today, compared to the OECD countries we are actually better than average. The OECD is made up of countries in Europe, the USA, Japan, Korea, Australia, New Zealand and Canada. The chart shows the percentage of GDP that government debt represents for various countries. The USA ended 2006 at 62% while the overall OECD total is 77%. In 1990 the USA was at 63% and the OECD was at 57%. Japan is the line way at the top with a 2006 total of 180% (that is a big problem for them). Korea is in the best shape at just a 28% total in 2006 but that is an increase from just 8% in 1990.
Related: Federal Deficit To Double This Year – Politicians Again Raising Taxes On Your Children – True Level of USA Federal Deficit – Who Will Buy All the USA’s Debt? – Top 12 Manufacturing Countries in 2007 – Oil Consumption by Country
Read more
Global manufacturing recession continued in February. From the Institute for Supply Management, the USA is in the 13th consecutive month of contraction:
Japanese Factory Output Posts Record Drop in January
European Manufacturing Contracts at Record Pace
…
The manufacturing index for Germany, Europe’s largest economy, was at 32.1 in February, lower than the initially reported 32.2, according to a separate report. Italy’s dropped to 35 from 36.1 and the French gauge declined to 34.8 from 37.9, less than the initial estimate.
…
The International Monetary Fund predicts the euro area economy will contract 2 percent this year.
In Korea, industrial output shark 26% in January, the largest decline even (statistics available since 1970). A one month period is not very significant but with a 26% decline that is still huge. And the December decline was 19%
China appears to be slowing the least of any sizable manufacturer:
It was the third straight month that the PMI came in higher than the month before, which provided some hope that China’s economy, which grew at its slowest pace in seven years in the fourth quarter of 2008, might be starting to stabilize. But economists are far from declaring an economic rebound.
Related: Manufacturing Employment Data from 1979 to 2007 – Top 12 Manufacturing Countries in 2007 – The Economy is in Serious Trouble – Japanese Economy Shrinks 12.7% – USA Job Growth (2007)
Who Will Buy All the USA’s Debt? That is a question worth thinking about. The USA is a huge net borrower. The government can’t borrow from consumers because they are hugely in debt themselves. Over the last few decades huge investments from Japan, China and the Middle East in USA government debt have allowed the huge amount of federal debt to continue to grow rapidly. But who is going to buy the increasing amounts of debt; in the next few years, and the next few decades?
China is right to have doubts about who will buy all America’s debt
…
The other area of concern for China is the value of its Treasuries. Given the US borrowing requirement and its lax monetary policy, Treasury bond yields could well rise sharply, causing a corresponding price decline. If China’s holdings match Treasuries’ average 48-month duration, then a 5pc rise in yields, from 1.72pc on the 5-year note to 6.72pc, would lose China 17.5pc of its holdings’ value, or $119bn.
Foreign buyers have absorbed a little over $200bn of Treasuries annually, a useful contribution to financing the $459bn 2008 deficit, but only a modest help towards the $1.35 trillion minimum average deficit forecast for 2009 and 2010.
Unless that changes substantially, there will be $1 trillion annually to be raised by the Treasury from domestic sources, more than double the previous record from domestic and foreign sources together, plus whatever is needed to bail out the banks.
Even if the US savings rate were to rise from zero to its long-term average of 8% of disposable personal income, that would create only an additional $830bn of savings — not enough to fund the domestic share of the deficit. Interest rates would probably have to rise substantially to pull in more foreign investors.
Very true. Anyone buying government debt at these rates has reason to question the wisdom of doing so. Exporters to the USA have macro-economic reasons for buying debt (to keep the value of the dollar from collapsing) but the investing reasons for buying USA debt I find very questionable (I wouldn’t be buying it as an investment, if I were them).
Related: Personal Saving and Personal Debt in the USA – Americans are Drowning in Debt – USA Federal Debt Now $516,348 Per Household – Is the USA Broke?
The Japanese economy shrank an amazing 12.7% in the fourth quarter of 2008. for comparison, the US economy fell by 3.8% in the quarter. Japan Economy Shrinks 12.7%, Steepest Drop Since 1974 Oil Shock
“There’s no doubt that the economy is in its worst state in the postwar period,” Economic and Fiscal Policy Minister Kaoru Yosano said in Tokyo. “The Japanese economy, which is heavily dependent on exports of autos, electronics and capital goods, has been severely hit by the global slowdown.”
…
Capital investment fell 5.3 percent. Manufacturers cut production by a record 11.9 percent in the quarter, indicating they have little need to buy equipment as factories lay idle. Consumer spending, which accounts for more than half of the economy, dropped 0.4 percent, as exporters fired workers.
…
The jobless rate surged to 4.4 percent in December from 3.9 percent, the biggest jump in four decades.
The decline is huge. Economies shrinking 2% is a large and fairly rare event. Shrinking over 10% is dramatically bad. The drop appears to be largely due to falling exports as consumer spending only dropped by .4 percent. Since 1930 the US economy has only fallen over 10% in a year 1932 and 1946. And real GDP has fallen over 2% only 5 times, the most recent time close to that large a fall was in 1982 with a 1.9% decline). Data from the United States Bureau of Economic Analysis. There is a good chance the US GDP will decline between 2-3% in 2009.
Related: Dreadful economic results in Japan suggest that things will only get gloomier – Over 500,000 Jobs Disappeared in November – Economic Fault: Income Inequality – Goldman Sachs Rakes In Profit in Credit Crisis (2007)
US living standards in jeopardy by James Jubak
…
the difference would get larger each year as the two rates were compounded. After 10 years at 2.3% growth, the U.S. economy would grow from $14.4 trillion in the third quarter of 2008 to $18.1 trillion, after accounting for inflation. At 3%, however, the U.S. economy would reach $19.4 trillion in gross domestic product.
…
The official unemployment rate hit 7.2% in December. Factor in part-time workers who would like to work full time and discouraged people who have stopped looking for work, and the real rate is more like 13.5%.
Some of those people won’t go back to work even when this recession is over because the relatively meager safety net supporting the unemployed in the United States will have given way beneath them. They will have suffered so much personal and family damage that they will never regain their full pre-recession productivity.
Related: Bad News on Jobs – The Economy is in Serious Trouble – Why Investing is Safer Overseas
Many Experts Say Health-Care System Inefficient, Wasteful
“We’re not getting what we pay for,” says Denis Cortese, president and chief executive of the Mayo Clinic. “It’s just that simple.”
“Our health-care system is fraught with waste,” says Gary Kaplan, chairman of Seattle’s cutting-edge Virginia Mason Medical Center. As much as half of the $2.3 trillion spent today does nothing to improve health, he says.
Not only is American health care inefficient and wasteful, says Kaiser Permanente chief executive George Halvorson, much of it is dangerous.
…
The United States today devotes 16 percent of its gross domestic product to medical care, more per capita than any other nation in the world. Yet numerous measures indicate the country lags in overall health: It ranks 29th in infant mortality, 48th in life expectancy and 19th out of 19 industrialized nations in preventable deaths.
One way to reconfigure health spending is to shift large sums into prevention and wellness, said Reed Tuckson, a physician and executive vice president at UnitedHealth Group in Minneapolis. The idea is to tackle the handful of preventable, chronic illnesses such as heart disease and diabetes that account for 75 percent of health-care costs.
…
the Dartmouth team concluded that as much as 30 percent of medical spending — or $700 billion — does nothing to improve care.
I continue to write about this serious problem for the USA. The credit crisis is an immediate crisis (with roots in many bad decisions over the last decade). But the health care crisis is just as deadly. The health care crisis is like a person smoking. It might not kill the economy immediately, but the huge harm down to the economy by the broken healthcare system is like a cancer on the economy.
Previous posts on problems and suggestions for improvement: PBS Documentary on Improving Hospitals – site and books on improving the health care system – International Health Care System Performance – USA Health Care Improvement – Broken Health Care System: Self-Employed Insurance – Excessive Health Care Costs – USA Spent $2.1 Trillion on Health Care in 2006
Continuation of: USA Manufacturing is Healthy
The real problem with the USA economy is that a country cannot live beyond its means forever. Those living in USA have consumed far more than they have produced for decades. That is not sustainable. The living beyond our means is mainly due to massively increased consumption, not shrinking output (in manufacturing or service). One, of many examples, of the increased consumption is average square footage of single-family homes in the USA: 1950 – 983; 1970 – 1,500; 1990 – 2,080; 2004 – 2,349.
In case it isn’t totally obvious to you. You don’t fix this problem by encouraging more spending and borrowing: either by the government or by consumers. The long term problem for the USA economy is that people have consuming more than they have been producing. Personally, as this continues you reach a point where getting another credit card does not work. The same holds true for the collective health of a country. A country cannot solve the problem of having bills come due from decades of living beyond its means by charging more so that they can continue to live beyond their means.
Where the USA is in the continuum, is hard for me to judge. For the sack of illustration, lets say a consumer can get to 10 cards before they finally fail. If the consumer reaches the limit on 2 credit cards they have the choice to continue to the party by getting another credit card. Or they have the choice of addressing the situation they have gotten themselves into. If they decide to become responsible they have a challenge but one they can endure with some hardships.
If they press on to 5 credit cards and then max them out they come to the same decision. Dig themselves deeper in debt to avoid the problem today or live up their past behavior and become responsible. The work they have ahead of themselves is much more challenging than if they had started working on the problem when they only had 2 cards.
If they press on to 9 cards and now have the decision again. The effort to find a solution may be almost impossible. Borrow more to pay for past mistakes while maintaining some expenditures may be possible (but they will have to live on less than they earn). By the time you are this far down the failed path you have so much going to pay for your past bills you can’t spend even close to what you currently earn on current expenses. Letting yourself get to this point is very bad. And most likely as a person you will go bankrupt.
Read more
When looking at the long term data, USA manufacturing output continues to increase. For decades people have been repeating the claim that the manufacturing base is eroding. It has not been true. I realize the economy is on weak ground today, I am not talking about that, I am looking at the long term trends.
The USA manufactures more than anyone else – by far. The percentage of total global manufacturing is the same today it was two decades ago (and further back as well). For decades people have been saying the USA has lost the manufacturing base – it just is not true. No matter how many times they say it does not make it true. It is true since 2000 the USA increase in manufacturing output (note not a decrease) has not kept pace with global grown in manufacturing output (global output in that period is up 47% and the USA is up 19% – Japan is down 10% for that period).
I would guess 20 years from today the USA will have a lower percentage of worldwide manufacturing. But I don’t see any reason believe the USA will see a decline in total manufacturing output. I just think the rest of the world is likely to grow manufacturing output more rapidly.
Looking at a year or even 2 or 3 years of manufacturing output data leaves a great deal of room to see trends where really just random variation exists. Even for longer periods trends are hard to project into the future.
Conventional wisdom is correct about China growing manufacturing output tremendously. China has grown from 4% of the output of the largest manufacturing companies in 1990 to manufacturing 16% of the total output in China today. That 12% had to come from other’s shares. And given all you hear from the general press, financial press, politicians, commentators… you would think the USA must have much less than China today, so may 10% and maybe they had 20% in 1990. When actually in 1990 the USA had 28% and in 2007 they had 27%.
Manufacturing jobs are not moving oversees. Manufacturing jobs are decreasing everywhere.
Read more
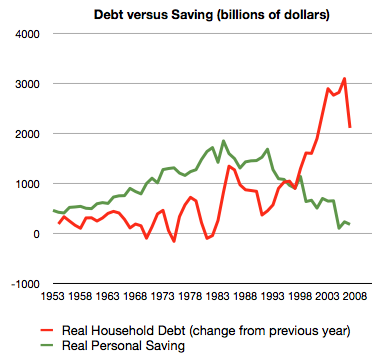
The whole sorry mess in one picture (including chart) by Philip Brewer
…
Starting back in about 2005, the American consumer reached the point that they could no longer service ever-increasing amounts of debt. That led to the housing bubble popping. The result is what you can see in the last datapoint on the graph–less new borrowing in 2007.
Related: $2,540,000,000,000 in USA Consumer Debt – Americans are Drowning in Debt – save an emergency fund – Financial Illiteracy Credit Trap – posts on saving money
In a recent article in Business Week Michael E. Porter makes some excellent points – Why America Needs an Economic Strategy:
Second, U.S. entrepreneurship has been fed by a science, technology, and innovation machine that remains by far the best in the world. While other countries increase their spending on research and development, the U.S. remains uniquely good at coaxing innovation out of its research and translating those innovations into commercial products.
…
Third, the U.S. has the world’s best institutions for higher learning, and they are getting stronger. They equip students with highly advanced skills and act as magnets for global talent, while playing a critical role in innovation and spinning off new businesses.
Fourth, America has been the country with the strongest commitment to competition and free markets.
…
An inadequate rate of reinvestment in science and technology is hampering America’s feeder system for entrepreneurship. Research and development as a share of GDP has actually declined, while it has risen in many other countries.
…
A creeping relaxation of antitrust enforcement has allowed mergers to dominate markets. Ironically, these mergers are often justified by “free market” rhetoric. The U.S. is seeing more intervention in competition, with protectionism and favoritism on the rise. Few Americans know that the U.S. ranks only 20th among countries in openness to capital flows, 21st on low trade barriers, and 35th on absence of distortions from taxes and subsidies
I have discussed similar idea in this blog and the Curious Cat Science and Engineering Blog: The Future is Engineering – Engineering the Future Economy – Science Gap – Not Understanding Capitalism