Amazon Prepares Online Advertising Program
This is potentially a real risk to Google. The odds of such a huge success it decreases Google’s profits are tiny (I think). But there is a real risk that the increase in Google’s profits going forward are materially affected by a well done competitor to Adsense.
Adwords is Google’s platform for buying ads. Those ads are then displayed on Google’s websites and on millions of other websites. Other websites can host ads via the Adsense program. It seems to me what is really at risk is better seen as Adsense business. The business on Google’s own websites is not at risk (Google’s profit from its sites are double I think all the other sites [via Adsense] combined).
If Amazon took away 10% of what Google’s Adsense business 4 years would have been that is likely material to Google’s earning. Not huge but real.
Even losing the ads on Amazon’s web site is likely noticeable (though not a huge deal, for Google, for many companies it would be significant, I would guess).
There is even the potential Google has to reduce their profitability, on Adsense, to compete – giving web sites a better cut of revenue.
One of the things that annoy me as an investor is how happy the executives are to grant themselves huge amount of pay in general and stock in particular. The love to giveaway huge amounts of stock to themselves and their buddies and then pretend that isn’t a cost.
Thankfully the GAAP rules changed a few years ago to require making the costs of stock giveaways show up on official earnings statements. Now, the companies love to trumpet non-GAAP earnings that exclude stock based compensation to employees.
The stock based costs are huge.
SG Securities estimates that corporates bought back $480 billion in stock last year, and then reissued about $180 billion.
The theme of the article is that stock buybacks have declined drastically very recently. There has been a huge bubble recently fueled by the too-big-too-fail bailout (quantitative easing). But don’t expect the executives giving themselves tons of stock to decline.
Accounting isn’t as straight forward as people who have never looked at it would like to think. While giving away stock is definately a cost, it isn’t a cash cost. The cash flow statement is best for looking at cash anyway. And the better your company does the more the free spirited giveaway of stock costs (both in your reduced share of the well performing company and the higher cost to buy back the shares they gave away).
They have excuses that they hire people who are not motivated enough to do their job for their pay so they need to offer stock options as a extra payment. But the main reason they like it is they can pretend that the pay to employees isn’t costing as much as it is because we gave them stock options not cash. As if paying $1 billion in cash is somehow more costly than giving away options and then spending $1 billion on buybacks of the stock they gave away.
Options make a lot of sense for small private companies. In a very limited way they can make sense as companies grow. But the practices of executives in huge bureaucracies giving away large amounts of your equity, on top of huge paychecks, is very harmful.
Related: Apple’s Outstanding Shares Increased from 848 to 939 million shares from 2006 to 2013 (while I think Apple’s large buyback is good, the huge share giveaways continue and are bad policy) – Google is Diluting Shareholder Equity by 1% a year (2009-2013) – Executives Again Treating Corporate Treasuries as Their Money
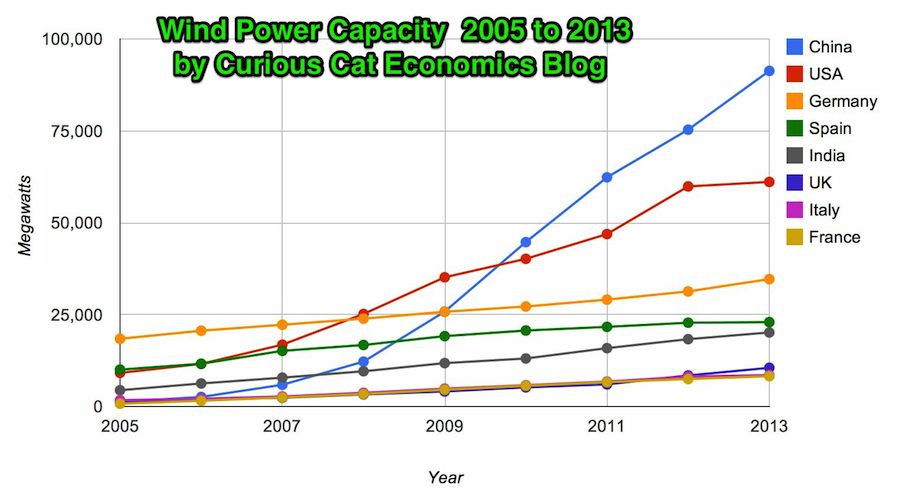
Chart by Curious Cat Economics Blog using data from the Wind Energy Association. Chart may be used with attribution as specified here.
In 2013 the addition to wind power capacity slowed a great deal in most countries. Globally capacity was increased just 13% (the increases in order since 2006: 26%, 27%, 29%, 32%, 25%, 19% and again 19% in 2012). China alone was responsible for adding 16,000 megawatts of the 25,838 total added globally in 2013.
At the end of 2013 China had 29% of global capacity (after being responsible for adding 62% of all the capacity added in 2013). In 2005 China had 2% of global wind energy capacity.
The 8 countries shown on the chart account for 81% of total wind energy capacity globally. From 2005 to 2013 those 8 countries have accounted for between 79 and 82% of total capacity – which is amazingly consistent.
Wind power now accounts for approximately 4% of total electricity used.
Related: Chart of Global Wind Energy Capacity by Country 2005 to 2012 – In 2010 Global Wind Energy Capacity Exceeded 2.5% of Global Electricity Needs – Global Trends in Renewable Energy Investment – Nuclear Power Generation by Country from 1985-2010
Hedge funds seek to pay the managers extremely well and claim to justify enormous paydays with claims of superior returns. Markets provide lots of volatility from which lots of different performances will result. Claiming the random variation that resulted in the superior performance of there portfolio as evidence the deserve to take huge payments for themselves from the current returns is not sensible. But plenty of rich people fall for it.
As I have written before: Avoiding Hedge Fund Investments is One of the Benefits of Being in the 99%.
This is pretty well understood by most knowledgeable investors, financial planners and investing experts. But funds that charge huge fees continue to get away with it. If you are smart you will avoid them. A few simple investing rules get you well into the top 10% of investors
- seek low fees
- diversify – pay attention to risk of portfolio overall
- limit trading (low turnover)
- use tax advantage accounts wisely (in the USA 401(k)s and IRAs)
From a personal finance perspective, saving money is a key. Most people fail at being decent investors before they even get a chance to invest by spending more than they can afford and failing to save, and even worse going into debt (other than to some extent for college education and house). Consistently putting aside 10-20% of your income and investing wisely will put you in good shape over the long term.
Options can be used as an aggressive strategy to make money with investments. By following news events for quite a few different companies you can put yourself in the position to act when stories break, or events occur which can cause mini trends in their stock price.
Volatile stocks with frequent news provide the opportunity to make money on large changes in price. Amazon is a company an Amazon that often makes headlines. Recently, they have been in the news quite a bit, and savvy binary options traders have been cleaning up.
Binary options are a type of option in which the payoff can take only two possible outcomes. The cash-or-nothing binary option pays some fixed amount of cash if the option expires in-the-money while the asset-or-nothing pays the value of the underlying security.
For example, a purchase is made of a binary cash-or-nothing call option on Amazon at $320 with a binary payoff of $1000. Then, if at the future maturity date, the stock is trading at or above $320, $1000 is received. If its stock is trading below $100, nothing is received. An investor could also sell a put where they would make a payoff if the conditions are met and have to payoff nothing if the conditions are not met.
Examples of big news in the recent past
Amazon Fire Cell Phone – Earlier this year, we watched as Jeff Bezos unveiled the new Amazon Fire 3-D cell phone. As happens in most cases when a company unveils a great new product, we saw this cell phone cause Amazon’s stock price to go through the roof. So, as a trader, seeing the unveiling happen first hand would indicate that the value of Amazon was going to rise, and give the trader unique opportunity to make trades on realistic expectations with this asset.
Brett Arends writes about the investment portfolio he uses?
It’s 10% each in the following 10 asset classes:
- U.S. “Minimum Volatility” stocks
- International Developed “Minimum Volatility” stocks
- Emerging Markets “Minimum Volatility” stocks
- Global natural-resource stocks
- US Real Estate Investment Trusts
- International Real Estate Investment Trusts
- 30-Year Zero Coupon Treasury bonds
- 30-Year TIPS
- Global bonds
- 2-Year Treasury bonds (cash equivalent)
This is another interesting portfolio choice. I have discussed my thoughts on portfolio choices several times. This one is again a bit bond heavy for my tastes. I like the global nature of this one. I like real estate focus – though as mentioned in previous articles how people factor in their personal real estate (home and investments) needs to be considered.
Related: Cockroach Portfolio – Lazy Golfer Portfolio – Investment Risk Matters Most as Part of a Portfolio, Rather than in Isolation – Looking for Dividend Stocks in the Current Extremely Low Interest Rate Environment
This is a startling piece of data, from The nagging fear that QE itself may be causing deflation:
The situations have many differences, for example, China is a poor country growing rapidly, Japan was a rich country growing little (though in 1990 it showed more growth promise than today). Still this one of the more interesting pieces of data on how much a bubble China real estate has today. Japan suffered more than 2 decades of stagnation and one factor was the problems created by the real estate price bubble.
The global economic consequences of the extremely risky actions taken to bail out the failed too-big-too-fail banks including the massive quantitative easing are beyond anyones ability to really understand. We hope they won’t end badly that is all it amounts to. Noone can know how risky the actions to bail out the bankers is. The fact we not only bailed them out, but showered many billions of profit onto them (even after taking billions in fines for the numerous and continuing violations of law by those bailed out bankers), leaves me very worried.
It seems to me we have put enormous risk on and the main beneficiaries of the policies are the bankers that caused the mess and continue to violate laws without any consequences (other than taking a bit of the profit them make on illegal moves back sometimes).
The West ignored pleas for restraint at the time, then left these countries to fend for themselves. The lesson they have drawn is to tighten policy, hoard demand, hold down their currencies and keep building up foreign reserves as a safety buffer. The net effect is to perpetuate the “global savings glut” that has starved the world of demand, and that some say is the underlying of the cause of the long slump.
I hope things work out. But I fear the extremely risky behavior by the central banks and politicians could end more badly than we can even imagine.
Related: Continuing to Nurture the Too-Big-To-Fail Eco-system – The Risks of Too Big to Fail Financial Institutions Have Only Gotten Worse – USA Congress Further Aids The Bankers Giving Those Politicians Piles of Cash and Risks Economic Calamity Again – Investment Options Are Much Less Comforting Than Normal These Days
I like charity that provides leveraged impact. I like charity that is aimed at building long term improvement. I like entrepreneurship. I like people having work they enjoy and can be proud of. And I like people having enough money for necessities and some treats and luxuries.
I think sites like oDesk provide a potentially great way for people to lead productive and rewarding lives. They allow people far from rich countries to tap into the market demand in rich counties. They also allow people to have flexible work arrangements (if someone wants a part time job or to work from home that is fine).
These benefits are also true in the USA and other rich countries (even geography – there are many parts of the USA without great job markets, especially many rural areas). The biggest problem with rich country residents succeeding on something like oDesk is they need quite a bit more money than people from other countries to get by (especially in the USA with health care being so messed up). There are a great deal of very successful technology people on oDesk (and even just freelancing in other ways), but it is still a small group that is capable and lucky enough to pull in large paychecks (it isn’t only technology but that is the majority of high paying jobs I think on oDesk).
But in poor countries with still easily 2 billion and probably much more there is a huge supply of good workers. There is a demand for work to be done. oDesk does a decent job of matching these two but that process could use a great deal of improvement.
I think if I became mega rich one of the projects I would have would be to create an organization to help facilitate those interested in internet based jobs in poor countries to make a living. It takes hard work. Very good communication is one big key to success (I have repeatedly had problems with capable people just not really able to do what was expected in communications). I think a support structure to help with that and with project management would be very good. Also to help with building skills.
If I were in a different place financially (and I were good at marketing which I am not) I would think about creating a company to do this profitably. The hard part for someone in a rich country to do this is that either they have to take very little (basically do it as charity) or they have to take so much cash off the top that I think it makes it hard to build the business.
But building successful organizations that can grow and provide good jobs to those without many opportunities but who are willing to work is something I value. I did since I was a kid living in Nigeria (for a year). I didn’t see this solution then but the idea of economic well being and good jobs and a strong economy being the key driver to better lives has always been my vision.
This contrast to many that see giving cash and good to those in need as good charity. I realize sometimes that is what is needed – especially in emergencies. But the real powerful change comes from strong economy providing people the opportunity to have a great job.
I share Dr. Deming’s personal aim was to advance commerce, prosperity and peace.
Related: Commerce Takes More People Out of Poverty Than Aid – Investing in the Poorest of the Poor – I am a big fan of helping improve the economic lives of those in the world by harnessing appropriate technology and capitalism – A nonprofit in Queens taught people to write iPhone apps — and their incomes jumped from $15k to $72k
Delaying when you start collecting Social Security benefits in the USA can enhance your personal financial situation. You may start collecting benefits at 62, but each year you delay collecting increases your payment by 5% to 8% (see below). If you retire before your “normal social security retirement age” (see below) your payments are reduced from the calculated monthly payment (which is based on your earnings and the number of years you paid into the social security fund). If you delay past that age you get a 8% bonus added to your monthly payment for each year you delay.
The correct decision depends on your personal financial situation and your life expectancy. The social security payment increases are based on life expectancy for the entire population but if your life expectancy is significantly different that can change what option makes sense for you. If you live a short time you won’t make up for missing payments (the time while you delayed taking payments) with the increased monthly payment amount.
The “normal social security retirement age” is set in law and depends on when you were born. If you were born prior to 1938 it is 65 and if you are born after 1959 it is 67 (in between those dates it slowly increases. Those born in 1959 will reach the normal social security retirement age of 67 in 2026.
The social security retirement age has fallen far behind demographic trends – which is why social security deductions are so large today (it used to be social security payments for the vast majority of people did not last long at all – they died fairly quickly, that is no longer the case). The way to cope with this is either delay the retirement ago or increase the deductions. The USA has primarily increased the deductions, with a tiny adjustment of the retirement age (increasing it only 2 years over several decades). We would be better off if they moved back the normal retirement age at least another 3 to 5 years (for the payment portion – given the broken health care system in the USA retaining medicare ages as they are is wise).
In the case of early retirement, a benefit is reduced 5/9 of one percent for each month (6.7% annually) before normal retirement age, up to 36 months. If the number of months exceeds 36, then the benefit is further reduced 5/12 of one percent per month (5% annually).
For delaying your payments after you have reached normal social security retirement age increases payments by 8% annually (there were lower amounts earlier but for people deciding today that is the figure to use).
Lets take a quick look at a simple example:
Read more
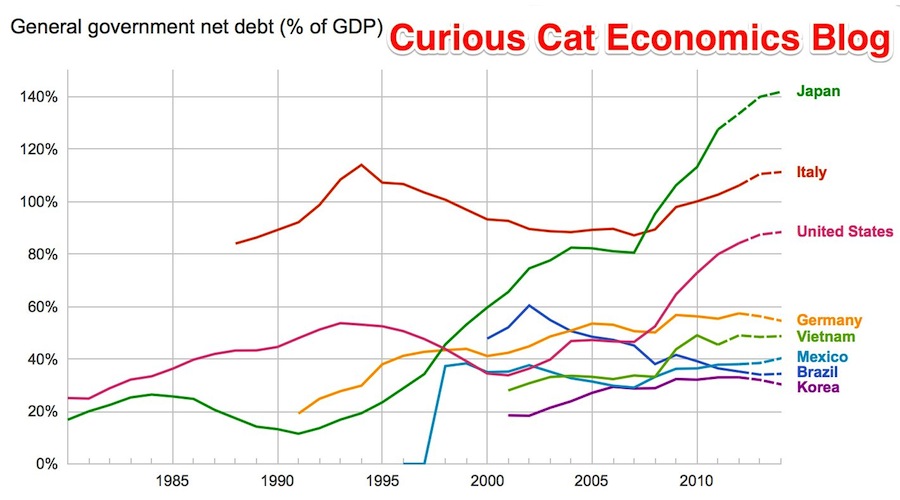
The data, from IMF, does not include China or India.
The chart shows data for net debt (gross debt reduced by certain assets: gold, currency deposits, debt securities etc.).
Bloomberg converted the data to look at debt load per person (looking at gross debt – estimated for 2014). Japan has ill-fortune to lead in this statistic with $99,725 in debt per person (242% of GDP), Ireland is in second with $60, 356 (121% of GDP). USA 3rd $58,604 (107%). Singapore 4th $56,980 (106%). Italy 6th $46,757 (133%). UK 9th $38,939 (95%). Greece 12th $38,444 (174%). Germany 14th $35,881 (78%). Malaysia 32nd $6,106 (57%). China 48th $1,489 (21%). India 53rd $946 (68%). Indonesia 54th $919 (27%).
I think the gross debt numbers can be more misleading than net debt figures. I believe Singapore has very large assets so that the “net” debt is very small (or non-existent). Japan is 242% in gross debt to GDP but 142% of net debt (which is still huge but obviously much lower). The USA in contrast has gross debt at 107% with a net debt of 88%.
Related: Government Debt as Percent of GDP 1998-2010 for OECD – Gross Government Debt as Percentage of GDP 1990-2009: USA, Japan, Germany, China – Chart of Largest Petroleum Consuming Countries from 1980 to 2010 – Top Countries For Renewable Energy Capacity