The unemployment rate in the USA continued the climb toward 10% in August in the aftermath of the credit crisis. Nonfarm payroll employment decline in August, by 216,000 more jobs, and the unemployment rate rose to 9.7%, the U.S. Bureau of Labor Statistics reported today. Since December 2007, employment has fallen by 6.9 million jobs.
In August, the number of unemployed persons increased by 466,000 to 14.9
million, and the unemployment rate rose to 9.7%. The unemployment rates for adult men (10.1%), whites (8.9%), and Hispanics (13.0%) rose in August. The jobless rates for adult women (7.6%), teenagers (25.5%), and blacks (15.1%) were little changed over the month.
The civilian labor force participation rate remained at 65.5% in August. The employment-population ratio, at 59.2%, edged down over the month and has declined by 3.5 percentage points since the recession began in December 2007.
In August, the number of persons working part time for economic reasons was little changed at 9.1 million. These individuals indicated that they were working part time because their hours had been cut back or because they were unable to find a full-time job.
In August, manufacturing employment continued to trend downward, with a decline of 63,000. The pace of job loss has slowed throughout manufacturing in recent months. Employment in health care continued to rise in August (28,000), with gains in ambulatory care and in nursing and residential care. Health care has added 544,000 jobs since the start of the recession.
In August, the average workweek for production and nonsupervisory
workers on private nonfarm payrolls was unchanged at 33.1 hours.
The manufacturing workweek and factory overtime also showed no
change over the month (at 39.8 hours and 2.9 hours, respectively).
Related: Unemployment Rate Drops Slightly to 9.4% – posts on employment – May 2009 Unemployment Rate Jumps to 9.4% – California Unemployment Rate Climbs to 10.5 Percent (March 2009)
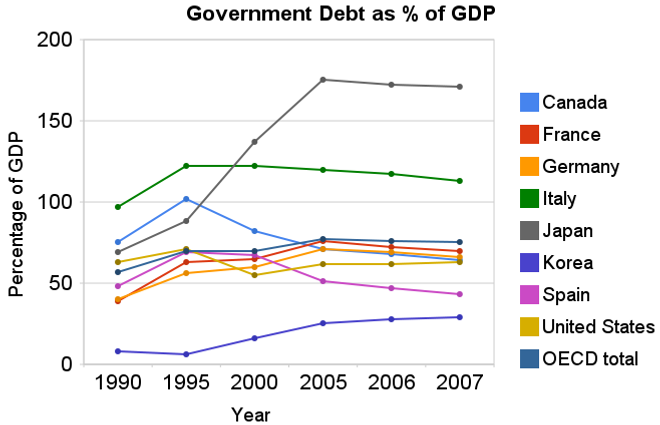 Chart showing government debt as a percentage of GDP by Curious Cat Investing Economics Blog, Creative Commons Attribution, data from OECD, Sept 2009.
For 2007 most countries slightly decreased their government debt to GDP ratio – as economic growth exceeded debt growth. The OECD is made up of countries in Europe and the USA, Japan, Korea, Australia, New Zealand and Canada. The overall OECD debt to GDP ratio decreased from 77% in 2005 to 75% in 2007. The USA moved in the opposite direction increasing from 62% to 63%: still remaining far below the OECD total. Most likely 2008, 2009 and 2010 will see both the USA and other OECD national dramatically increase the debt burden.
Compared to the OECD countries the USA is actually better than average. The chart shows the percentage of GDP that government debt represents for various countries. The USA ended 2007 at 63% while the overall OECD total is 75%. In 1990 the USA was at 63% and the OECD was at 57%. Japan is the line way at the top with a 2007 total of 171% (that is a big problem for them). Korea is in the best shape at just a 29% total in 2007 but that is an increase from just 8% in 1990.
Related: Government Debt as a Percentage of GDP Through 2006 – Oil Consumption by Country in 2007 – Federal Deficit To Double This Year – Politicians Again Raising Taxes On Your Children – True Level of USA Federal Deficit – Top 12 Manufacturing Countries in 2007
Read more
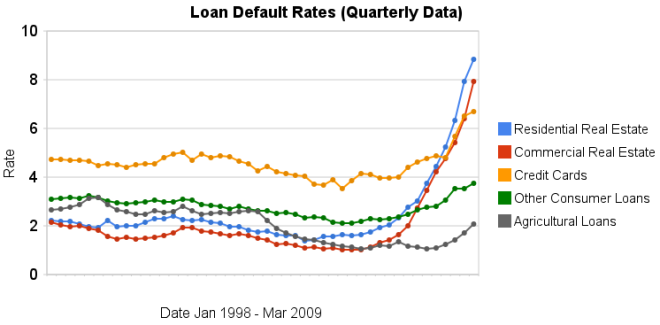 Chart showing loan delinquency rates for real estate, consumer and agricultural loans for 1998 to 2009 by the Curious Cat Investing Economics Blog, Creative Commons Attribution, data from the Federal Reserve.
Delinquency rates on commercial (up another 151 basis points) and residential (93 basis points) real estate continued to increase dramatically in the second quarter. Credit card delinquency rates increased but only by 20 basis points.
Real estate delinquency rates exploded in 2008. In the 4th quarter of 2007 residential delinquency rates were 3.02% by the 4th quarter of 2008 they were 6.34% and in the 2nd quarter of this year they were 8.84% (582 basis points above the 4th quarter of 2007). Commercial real estate delinquency rates were at 2.74% in the 4th quarter of 2007, 5.43% in the fourth quarter of 2008 and 7.91% in the 2nd quarter of 2009 (a 517 basis point increase).
Credit card delinquency rates were much higher than real estate default rates for the last 10 years (the 4-5% range while real estate hovered above or below 2%). Now they are over 200 and 300 basis points bellow residential and commercial delinquency rates respectively. From 4.8% in the 3rd quarter 2008 to 5.66% in the 4th and 6.5% in the 1st quarter of 2009.
The delinquency rate on other consumer loans and agricultural loan delinquency rates are up but nowhere near the amounts of real estate or credit cards.
As I wrote recently bond yields in the last few months show a dramatic increase in investor confidence for corporate bonds.
Related: Loan Delinquency Rates: 1998-2009 – The Impact of Credit Scores and Jumbo Size on Mortgage Rates – 30 Year Mortgage Rate and Federal Funds Rate Chart
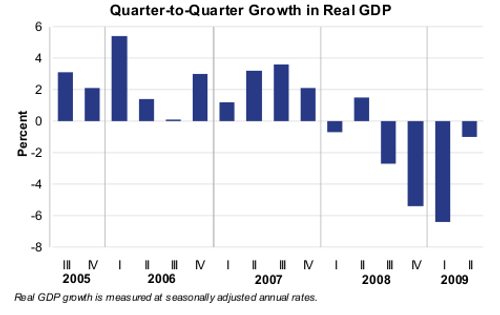 Chart from the Bureau of Economic Analysis showing the quarter to quarter growth in real GDP from 2005-2009.
Current-dollar GDP — the market value of the nation’s output of goods and services — decreased 1.0%, or $34.7 billion, in the second quarter to a level of $14,143.3 billion. In the first quarter, current-dollar GDP decreased 4.6%, or $169.3 billion.
More details on 2nd quarter, 2009 GDP.
Related: First Quarter GDP 2009 down 6.1% – Economists Raise Projections for Second Half of 2009 – What the Bailout and Stimulus Are and Are Not
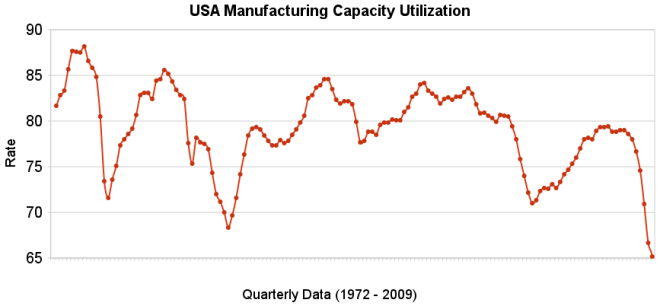 The chart shows the capacity utilization rate in the USA. By Curious Cat Investing Economics Blog, Creative Commons Attribution, data from the Federal Reserve.
Industrial production increased .5% in July and capacity utilization rate increased to 68.5% from an all time low of 68.1%. Capacity utilization has averaged 80.9% from 1972 to today.
Manufacturing output increased 1.0% in July but remained 14.4% lower than its year-earlier level. The factory operating rate rose to 65.4% in July, 70 basis points above the historical low recorded in June; the series begins in 1948. Production in durable goods industries advanced 2.2% in July. In addition to the sharp increase in motor vehicles and parts output, large production gains occurred for nonmetallic mineral products and for primary metals. The indexes for wood products, computer and electronic products, aerospace and miscellaneous transportation equipment, furniture and related products, and miscellaneous goods also rose. The indexes for fabricated metal products, machinery, and electrical equipment declined.
The production of nondurable goods fell 0.1% in July. The indexes for textile and product mills and for printing and support recorded sizable declines; the indexes for food, beverages, and tobacco and for petroleum and coal products also declined. The output of paper, of chemicals, and of plastic and rubber products increased.
The index for other manufacturing, which consists of publishing and logging, was down 0.6% in July.
The output of electric and gas utilities decreased 2.4%, and the operating rate for utilities dropped 21 basis points, to 77.6%. Mining production moved up 0.8%; its utilization rate in July, at 81.7%, was 59 basis points below its 1972-2008 average.
Data from the St. Louis Federal Reserve and Federal Reserve August 14th Industrial Production and Capacity Utilization press release.
Related: Loan Default Rates: 1998-2009 – Government Debt as a Percentage of GDP – USA Spent $2.2 Trillion, 16.2% of GDP, on Health Care in 2007
Read more
On the heels of the Japanese economy shrinking at 12.7% rate 2 quarters ago, the Japanese economy grew at a 3.7% annual rate in the second quarter. Japan is the 2nd largest economy (after the USA). Japan’s economy leaves recession:
…
Japan is heavily reliant on its exports so growth overseas could bode well for its recovery.
…
The French and German economies both grew by 0.3% between April and June, bringing to an end recessions in Europe’s largest economies that have lasted a year. Analysts had not expected the data, suggesting recovery could be faster than previously expected.
And Hong Kong recorded growth of 3.3% in the three months from April to June. That data was also better than had been expected, with the government subsequently increasing its forecast for growth in the whole year.
The global economic recovery seems to be taking shape more quickly than anticipated. However, we are still far from in the clear. The risks to short term economic recovery are still great. And the largest long term economic problems for the USA (massive federal debt, huge consumer debt [both the government and the people living far beyond their means] and an very expensive and harmful health care system) have not been addressed. If we are very very lucky the increased saving rate in the last 6 months will continue but it is very questionable if that will continue.
Related: Manufacturing Employment Data, 1979 to 2007 – Government Debt as a Percentage of GDP – Politicians Again Raising Taxes On Your Children (Jan 2008)
Fed Focusing on Real-Estate Recession as Bernanke Convenes FOMC
…
Commercial property is “certainly going to be a significant drag” on growth, said Dean Maki, a former Fed researcher who is now chief U.S. economist in New York at Barclays Capital Inc., the investment-banking division of London-based Barclays Plc. “The bigger risk from it would be if it causes unexpected losses to financial firms that lead to another financial crisis.”
…
Any sales of mortgage-backed bonds would be the first new issues in the $700 billion U.S. market for commercial-mortgage- backed securities since it was shut down by the credit freeze in 2008. About $3 billion are in the pipeline, and the success of these sales may foster as much as $25 billion in total deals in the next six months
…
Forty-seven percent of loans at the 7,000-plus smaller U.S. lenders are in commercial real estate, compared with 17 percent for the biggest banks…
Related: Data Shows Subprime Mortgages Were Failing Years Before the Crisis Hit – Home Values and Rental Rates – Record Home Price Declines (Sep 2008)
The USA unemployment rate dropped slightly to 9.4%. The economy lost 247,000 jobs which is both a sign the economy is not strong and also that it is improving (job losses from November through April were 645,000/month and 331,000/month from May through July). The job losses for May and June were both revised to show 20,000 fewer job losses each in the press release from the Bureau of Labor Statistics.
The number of long-term unemployed (those jobless for 27 weeks or more) rose by 584,000 over the month to 5.0 million. In July, 1 in 3 unemployed persons were jobless for 27 weeks or more.
The employment-population ratio, at 59.4%, was little changed over the month but has declined by 330 basis points since the recession began in December 2007. About 2.3 million persons were marginally attached to the labor force in July, 709,000 more than a year earlier (The data are not seasonally adjusted). These individuals, who were not in the labor force, wanted and were available for work and had looked for a job sometime in the prior 12 months. They were not counted as unemployed because they had not searched for work in the 4 weeks preceding the survey.
In July, the average workweek of production and nonsupervisory workers on private nonfarm payrolls edged up by 0.1 hour to 33.1 hours. The manufacturing workweek increased by 0.3 hour to 39.8 hours. Factory overtime was unchanged at 2.9 hours.
This news supports the increasing livelihood of a weak recovery taking hold during 2009 – which is frankly pretty amazing in my opinion. The economy could certainly have taken longer to recover. Still, more job losses and an increasing unemployment rate are likely before the end of 2009.
Related: Another 450,000 Jobs Lost in June – USA Unemployment Rate Jumps to 9.4% (May 2009) – USA Unemployment Rate Rises to 8.1%, Highest Level Since 1983 (March 2009)
Read more
Here is a good blog post showing one great feature of the blogosphere (that term seems to have fallen out of use hasn’t it): interaction. It also shows that you have to think critically. You can’t just accept what you read (you never can, but that is even more true with blogs than it is with newspapers that at least have some standards normally). I tend to agree with this posts look at the data, though I have not examined the issue closely.
Bad Math, Bad Statistics: Trying to get a blogger to admit a mistake
1981: 229465714 * 8476.0 = 1.944 trillion
1992: 255029699 * 14847.0 = 3.786 trillion (94% gain)
2005: 292892127 * 25036.0 = 7.332 trillion (93.6% gain)
Er, doesn’t look like a lag to me. In fact, it looks like it’s doubling every 12-13 years just as much as GDP is. I also looked up total income statistics for the US, and found the following figures (source). (Note these figures are different. More on that later.)
1981: $2,580,600,000 (2.58 / 3.1 = 83% of GDP)
1992: $5,349,384,000 (more than double!) (5.34 / 6.2 = 86% of GDP)
2005: $10,252,973,000 (another double!) (10.25 / 12.4 = 82% of GDP)
Anyway it is a much more interesting argument than I would hear when I listened to TV “pundits” years ago spout meaningless talking points at each other. Granted they argument is not going to be studied as a wonderful example of how we should debate. Still it is much above what passes for debate from our politicians (yes this is more a sad commentary on how failed our politicians are than a statement of how marvelous the argument on the GDP issue is between the two bloggers).
Here is a math question for you, what has a bigger impact moving from 15 to 18 mpg or 50 to 100 mpg?
Related: Government Debt as a Percentage of GDP – USA Consumers Paying Down Debt – Is Productivity Growth Bad? – Americans are Drowning in Debt
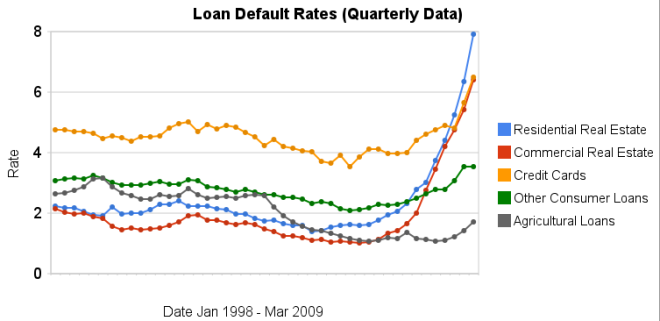 Chart showing loan default rates for real estate, consumer and agricultural loans for 1998 to 2009 by the Curious Cat Investing Economics Blog, Creative Commons Attribution, data from the Federal Reserve.
As you can see real estate default rates exploded in 2008. In the 4th quarter of 2007 residential default rates were 3.02% by the 4th quarter of 2008 they were 6.34% and in the 1st quarter of this year they were 7.91% (471 basis points above the 4th quarter of 2007). Commercial real estate default rates were at 2.74 in the 4th quarter of 2007, 5.43% in the fourth quarter of 2008 and 6.5% in the 1st quarter of 2009 (a 366 basis point increase).
Credit card default rates were much higher for the last 10 years (the 4-5% range while real estate hovered above or below 2%). In the last 2 quarters it has increased sharply. From 4.8% in the 3rd quarter 2008 to 5.66% in the 4th and 6.5% in the 1st quarter of 2009. The default rate on other consumer loans are up but nowhere near the amounts of real estate or credit cards.
Agricultural loan default rates are actually about as low now as they have every been 1.71%. That is up a bit from the 1.06% low the default rate hit in the 1st quarter of 2009 but actually lower than it was for half of the last decade (the last 5 years it has been lower but prior to that it was higher – in fact with higher default rates than either real estate loan category).
Related: Mortgage Rates: 6 Month and 5 Year Charts – Jumbo Loan Defaults Rise at Fast Pace – Continued Large Spreads Between Corporate and Government Bond Yields – Nearly 10% of Mortgages Delinquent or in Foreclosure