Mark Mobius is an investment manager with Franklin-Templeton that I have invested with for over a decade (through the Templeton Emerging Markets Trust and Templeton Dragon Fund – they are closed end funds). I believe in Templeton’s emerging market investment team and Mark Mobius and believe his thoughts are worth paying attention to. He recently wrote an overview on Emerging Markets:
…
In Mexico, GDP contracted 10% y-o-y in the second quarter of 2009 as a result of the global economic crisis and swine flu outbreak. In comparison, GDP fell 8% in the first quarter of the year. Declines in the manufacturing, construction and retail sectors had negatively impacted GDP during the period.
…
Since 1995, portfolio inflows into emerging markets have totaled more than US$123 billion. A significant amount, considering it includes the US$49 billion in net outflows in 2008 as a result of the global financial crisis. The recovery in emerging markets and hunt for attractive investment opportunities, however, saw these funds return just as quickly with inflows totaling more than US$44 billion in the first seven months of 2009, nearly 90% of the outflows registered all of last year.
…
Emerging markets account for more than 80% of the world’s population. With economic growth accelerating and population growth decelerating, per capita income is one the rise. In our view, markets such as China, India and Brazil stand at the front of the class.
…
As of end-August 2009, the benchmark MSCI Emerging Markets index had a P/E of 16 times, cheaper than the MSCI World index which was trading at a P/E of 21 times.
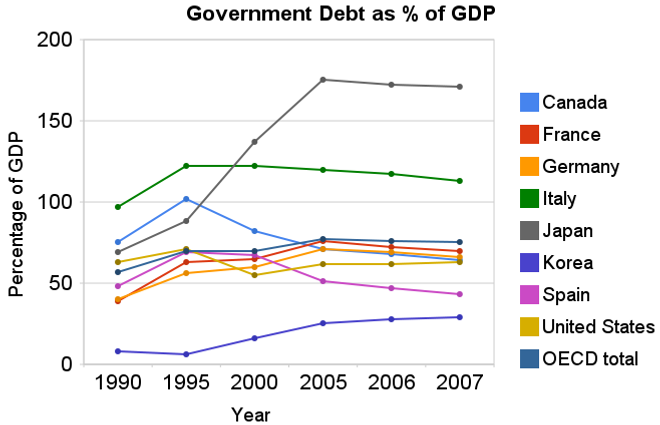 Chart showing government debt as a percentage of GDP by Curious Cat Investing Economics Blog, Creative Commons Attribution, data from OECD, Sept 2009.
For 2007 most countries slightly decreased their government debt to GDP ratio – as economic growth exceeded debt growth. The OECD is made up of countries in Europe and the USA, Japan, Korea, Australia, New Zealand and Canada. The overall OECD debt to GDP ratio decreased from 77% in 2005 to 75% in 2007. The USA moved in the opposite direction increasing from 62% to 63%: still remaining far below the OECD total. Most likely 2008, 2009 and 2010 will see both the USA and other OECD national dramatically increase the debt burden.
Compared to the OECD countries the USA is actually better than average. The chart shows the percentage of GDP that government debt represents for various countries. The USA ended 2007 at 63% while the overall OECD total is 75%. In 1990 the USA was at 63% and the OECD was at 57%. Japan is the line way at the top with a 2007 total of 171% (that is a big problem for them). Korea is in the best shape at just a 29% total in 2007 but that is an increase from just 8% in 1990.
Related: Government Debt as a Percentage of GDP Through 2006 – Oil Consumption by Country in 2007 – Federal Deficit To Double This Year – Politicians Again Raising Taxes On Your Children – True Level of USA Federal Deficit – Top 12 Manufacturing Countries in 2007
Read more
The largest oil consuming countries (and EU), in millions of barrels per day for 2007. China increased use by 1 billion barrels a day, the USA and Europe decreased use by 100 million barrels a day from our post last year on Oil Consumption by Country.
| Country | consumption | % of oil used | % of population | % of World GDP | % of oil used in 2006 |
|---|---|---|---|---|---|
| USA | 20.7 | 24.3 | 4.5 | 21.0 | 25.9 |
| European Union | 14.4 | 16.9 | 7.4 | 21.9 | 18.1 |
| China | 7.9 | 9.2 | 19.9 | 10.8 | 8.6 |
| Japan | 5.0 | 5.8 | 1.8 | 6.5 | 6.7 |
| India | 2.7 | 3.1 | 17.3 | 4.5 | 3.0 |
| Russia | 2.7 | 3.1 | 2.0 | 3.1 | 3.6 |
| Germany | 2.5 | 2.8 | 1.2 | 4.2 | 3.3 |
| Brazil | 2.4 | 2.7 | 2.9 | 2.8 | 2.6 |
| Canada | 2.4 | 2.7 | 0.4 | 1.9 | 2.9 |
| Mexico | 2.1 | 2.4 | 1.6 | 2.0 | 2.6 |
| South Korea | 2.1 | 2.4 | 0.7 | 1.8 | 2.7 |
Data is from CIA World Factbook 2009 (downloaded August 2009). GDP calculated using purchasing power parity from 2008 fact book with estimated 2007 data.
Related: Government Debt as a Percentage of GDP – Global Manufacturing Production by Country – Manufacturing Contracting Globally (March 2009)
Ok, maybe moving to lower your cell phone bill would be a bit extreme. But the cost of cell phone service is almost 5 times as high in the USA as in Finland:
Mobile phone calls lowest in Finland, Netherlands and Sweden
Comparing prices on a medium-use basis for a package of 780 voice calls, 600 short texts (SMS), and eight multimedia (MMS) messages, the survey found monthly prices ranged from 11 to 53 US dollars across countries as of August 2008.
…
The OECD Communications Outlook says between 2006 and 2008 mobile phone call prices fell on average by 21% for low usage consumers, 28% for medium usage and by 32% for subscribers with the highest consumption patterns.
Related: Kiss Your Phone Bill Good-bye – money saving ideas – Investing dictionary
 photo of Cesar Augusto Santamaría Escoto in his welding workshop, Chinandega, Nicaragua.
I made my 100th contribution to a micro-loan through Kiva last week. Participating with Kiva is a great antidote to reading about the unethical “leaders” taking huge sums to run their companies into the ground (or even just taking obscene sums to maintain their company). The opportunity to give real capitalists an chance at a better life is wonderful.
Kiva allows you to lend money to entrepreneur (in increments of $25). The most you get back is the amount you loaned, and if the entrepreneur, does not pay back the loan then you take a loss. This is something you do if you believe if giving people an opportunity to make a better life for themselves through hard work and intelligent economic choices.
I encourage you to join me: let me know if you contribute to Kiva and I will add your Kiva page to our list of Curious Cat Kivans. Also join the Curious Cats Kiva Lending Team.
My loans have been made to in 32 countries including: Ghana, Cambodia, Uganda, Viet Nam, Peru, Ukraine, Mongolia, Ecuador and Tajikistan. Kiva provides sector (but I think this data is a not that accurate – it depends on the Kiva partners that are not that accurate on identifying the sectors (it seems to me). A large number of the loans are in retail, clothing and food. I like making loans that will improve productivity (manufacturing, providing productivity enhancing services…) but can’t find as many of those as I would like (8% of my loans are in manufacturing, 11% agriculture, retail 18%, 23% food, 25% services (very questionable – these are normally really retail or food, it seems to me).
Some examples of the entrepreneurs I have lent to: welding workshop (Nicaragua), expanding generator services business with computer services (Cambodia), food production (Ghana), manufacturing nylon (Nigeria), internet cafe (Lebanon), electronics repair (Benin), new engine for mill (Togo), weaving (Indonesia) and a food market (Mexico).
Related: Financial Thanksgiving – MicroFinance Currency Risk – Creating a World Without Poverty – Provide a Helping Hand
21 of my loans have been paid back in full. 3 have defaulted. Those figure give a distorted picture though (I believe). There was a problem with a Kiva partner (they partner with micro-finance banks around the world) MIFEX, in Ecuador. Kiva discovered that MIFEX (i) improperly inflated the loan amounts it posted for entrepreneurs on the Kiva website and (ii) kept the excess amount of the posted loan to fund its own operational expenses. Kiva does not expect any further payments on these loans. I had 2, so I think those 2 give a fair impression. The 3rd default is from Kenya. That loan was to a business selling bicycle parts. In 2008, in Kenya, the prevailing political crisis deteriorated and businesses have either been destroyed or closed in fear of looters. Technically the loan did default, however, I was paid $71.50 out of $75 loan (so the defaulted amount was very small.
Read more
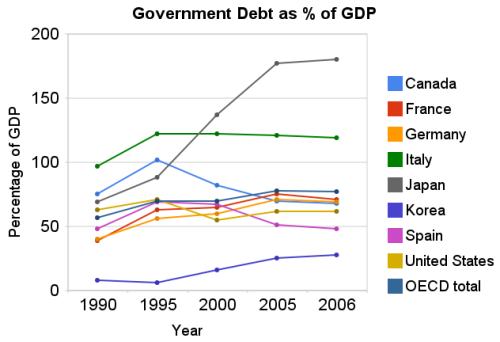 Chart showing government debt as a percentage of GDP by Curious Cat Investing Economics Blog, Creative Commons Attribution, data from OECD, March 2009.
The USA federal government debt is far too large, in my opinion. We have been raising taxes on future taxpayers for several decades, to finance our current spending. Within reason deficit spending is fine. What that reasonable level is however, is not easy to know. One big problem with the past few decades is that during very prosperous economic times we spent money that we didn’t have, choosing to raise taxes on the future (instead of either not spending as much or paying for what we were spending by raising taxes to pay for current spending).
By not even paying for what we are spending when times were prosperous we put ourselves in a bad situation when we have poor economic conditions – like today. If we were responsible during good economic times (and at least paid for what we spent) we could have reduced our debt as a percentage of GDP. Even if we did not pay down debt, just by not increasing the outstanding debt while the economy grew the ratio of debt to GDP would decline. Then when times were bad, we could afford to run deficits and perhaps bring the debt level up to some reasonable level (maybe 40% of GDP – though it is hard to know what the target should be, 40% seems within the realm of reason to me, for now).
There is at least one more point to remember, the figures in the chart are based on reported debt. The USA has huge liabilities that are not accounted for. So you must remember that the actually debt is much higher than reported in the official debt calculation.
Now on to the good news. As bad as the USA has been at spending tomorrows increases in taxes today, compared to the OECD countries we are actually better than average. The OECD is made up of countries in Europe, the USA, Japan, Korea, Australia, New Zealand and Canada. The chart shows the percentage of GDP that government debt represents for various countries. The USA ended 2006 at 62% while the overall OECD total is 77%. In 1990 the USA was at 63% and the OECD was at 57%. Japan is the line way at the top with a 2006 total of 180% (that is a big problem for them). Korea is in the best shape at just a 28% total in 2006 but that is an increase from just 8% in 1990.
Related: Federal Deficit To Double This Year – Politicians Again Raising Taxes On Your Children – True Level of USA Federal Deficit – Who Will Buy All the USA’s Debt? – Top 12 Manufacturing Countries in 2007 – Oil Consumption by Country
Read more
Global manufacturing recession continued in February. From the Institute for Supply Management, the USA is in the 13th consecutive month of contraction:
Japanese Factory Output Posts Record Drop in January
European Manufacturing Contracts at Record Pace
…
The manufacturing index for Germany, Europe’s largest economy, was at 32.1 in February, lower than the initially reported 32.2, according to a separate report. Italy’s dropped to 35 from 36.1 and the French gauge declined to 34.8 from 37.9, less than the initial estimate.
…
The International Monetary Fund predicts the euro area economy will contract 2 percent this year.
In Korea, industrial output shark 26% in January, the largest decline even (statistics available since 1970). A one month period is not very significant but with a 26% decline that is still huge. And the December decline was 19%
China appears to be slowing the least of any sizable manufacturer:
It was the third straight month that the PMI came in higher than the month before, which provided some hope that China’s economy, which grew at its slowest pace in seven years in the fourth quarter of 2008, might be starting to stabilize. But economists are far from declaring an economic rebound.
Related: Manufacturing Employment Data from 1979 to 2007 – Top 12 Manufacturing Countries in 2007 – The Economy is in Serious Trouble – Japanese Economy Shrinks 12.7% – USA Job Growth (2007)
Why the Germans just hate to spend, spend, spend
…
US, French and British officials puzzle over Germany’s refusal to tackle the recession head-on. German leaders, meanwhile, cannot see why their taxpayers’ money should go into encouraging precisely the kind of behaviour – reckless lending, careless borrowing and overconsumption – that precipitated the financial crisis.
I am with the Germans on this one. The people that want to find some more credit cards to run up don’t understand the problem. Until they come up with strong policies that admit we have been living beyond our means for decades and have to pay for this at some point and fashion a policy based on that understanding we are in danger. Yes another credit card can allow you to continue to live beyond your means, but it also puts you into even worse financial shape than you have already gotten yourself into. It is not a solution, it is an emergency to deal with the complete failure of yourself previously and without a plan to change it is just setting yourself up for a worse situation soon.
Related: How to Use Your Credit Card Responsibly – Have you Saved Your Emergency Fund Yet? – Can I Afford That? – Too Much Stuff
I have had difficulty finding good economic data on manufacturing jobs. I have posted about this previously but have trouble finding much worth posting about: Worldwide Manufacturing Job Data – Manufacturing Jobs. The Unites States Department of Labor, Bureau of Labor Statistics has published some interesting data and so here is a look at some of that data.
The table shows average annual productivity gains (output per hour, in USA dollars – I think it is not clear) – the 2007 output totals are from the United Nations data I posted about last week (Data on Top Manufacturing Countries).
| Average Annual Manufacturing Productivity Gains by Country | ||||||
|---|---|---|---|---|---|---|
| Country | 1979-1990 | 1990-1995 | 1995-2000 | 2000-2007 | 1979-2007 | 2007 Output $USA billion |
| Taiwan | 6.1 | 4.7 | 5.6 | 6.4 | 5.9 | |
| Korea | NA | 9.4 | 10.8 | 7.6 | NA | 241 |
| USA | 2.8 | 3.7 | 5.6 | 4.6 | 3.9 | 1,831 |
| France | 3.8 | 3.4 | 4.6 | 3.5 | 3.8 | 296 |
| Japan | 3.8 | 3.3 | 3.4 | 3.8 | 3.6 | 926 |
| United Kingdom | 4.1 | 2.8 | 2.7 | 3.9 | 3.6 | 342 |
| Germany | 2.1 | 2.9 | 3.7 | 3.8 | 3.0 | 670 |
| Spain | 3.3 | 3.1 | 0.8 | 2.1 | 2.5 | 208 |
| Canada | 2.1 | 3.4 | 3.8 | 1.1 | 2.4 | 218 |
| Italy | 3.4 | 3.8 | 1.4 | -.2 | 2.2 | 345 |
The countries that were part of the study but are not included in the table above: Australia, Belgium, Denmark, Netherlands, Norway, Sweden.
Manufacturing productivity increased in 14 of 16 countries in 2007, according to the study. The United States of America increase of 4.1 was the fourth largest among the 16 economies and was slightly above the 3.9 percent U.S. average annual increase since 1979. 15 of the 16 countries increased manufacturing output in 2007.
9 countries increased manufacturing hours worked in 2007, the USA increased 2.3% (below their average increase since 1979). Hours worked decreased for all countries in the period of 2000-2007 (UK has had the largest decrease 3.9% annual average decrease, the USA in next at 3.1%).
Manufacturing employment increased in 10 countries in 2007. From 2000-2007 the USA has experienced average annual declines of 3% in manufacturing employment (the second sharpest drop to the UK which has fallen 4%). From 1979-2007 the USA annual declines averaged 1.2% (only Taiwan.9% and Spain .1% showed increases). From 2000-2007 four countries show slight average annual increases: Spain .5%, Korea .4%, Taiwan .2% and Italy .2%. From 2000-2007 only 3 countries showed annual average decreases in output: Canada -.3%, Italy -.2% and UK – .1%.
Hourly manufacturing compensation has increased in all countries for the period 1979-2007 (data shown for this item is in each national currency: USA 4.6% average annual increases, Spain up 7.2% annually, Taiwan up 7%, UK 6.8%, Germany 4.4%, Japan 4.2%.
via: Canada’s Manufacturing Crisis in International Perspective
Related: posts on employment – Top 10 Manufacturing Countries 2006
The updated data from the United Nations on manufacturing output by country clearly shows the USA remains by far the largest manufacturer in the world. UN Data, in billions of current US dollars:
| Country | 1990 | 1995 | 2000 | 2005 | 2006 | 2007 |
|---|---|---|---|---|---|---|
| USA | 1,041 | 1,289 | 1,543 | 1,663 | 1,700 | 1,831 |
| China | 143 | 299 | 484 | 734 | 891 | 1,106 |
| Japan | 804 | 1,209 | 1.034 | 954 | 934 | 926 |
| Germany | 438 | 517 | 392 | 566 | 595 | 670 |
| Russian Federation | 211 | 104 | 73 | 222 | 281 | 362 |
| Italy | 240 | 226 | 206 | 289 | 299 | 345 |
| United Kingdom | 207 | 219 | 228 | 269 | 303 | 342 |
| France | 224 | 259 | 190 | 249 | 248 | 296 |
| Korea | 65 | 129 | 134 | 200 | 220 | 241 |
| Canada | 92 | 100 | 129 | 177 | 195 | 218 |
| Spain | 101 | 103 | 98 | 164 | 176 | 208 |
| Brazil | 120 | 125 | 96 | 137 | 170 | 206 |
| Additional countries of interest – not the next largest | ||||||
| India | 50 | 59 | 67 | 118 | 135 | 167 |
| Mexico | 50 | 55 | 107 | 122 | 136 | 144 |
| Indonesia | 29 | 60 | 46 | 80 | 102 | 121 |
| Turkey | 33 | 38 | 38 | 75 | 85 | 101 |
The USA’s share of the manufacturing output of the countries that manufactured over $200 billion in 2007 (the 12 countries on the top of the chart above) in 1990 was 28%, 1995 28%, 2000 33%, 2005 30%, 2006 28%, 2007 27%. China’s share has grown from 4% in 1990, 1995 7%, 2000 11%, 2005 13%, 2006 15%, 2007 16%.
Total manufacturing output in the USA was up 76% in 2007 from the 1990 level. Japan, the second largest manufacturer in 1990, and third today, has increased output 15% (the lowest of the top 12, France is next lowest at 32%) while China is up an amazing 673% (Korea is next at an increase of 271%).
Read more